Be a Data Detective
During this unit, students developed data literacy by participating in and leading data talks, analyzing data representatives in the real world, creating bivariate displays of data they collected, and identifying the criteria for being “a data detective”.
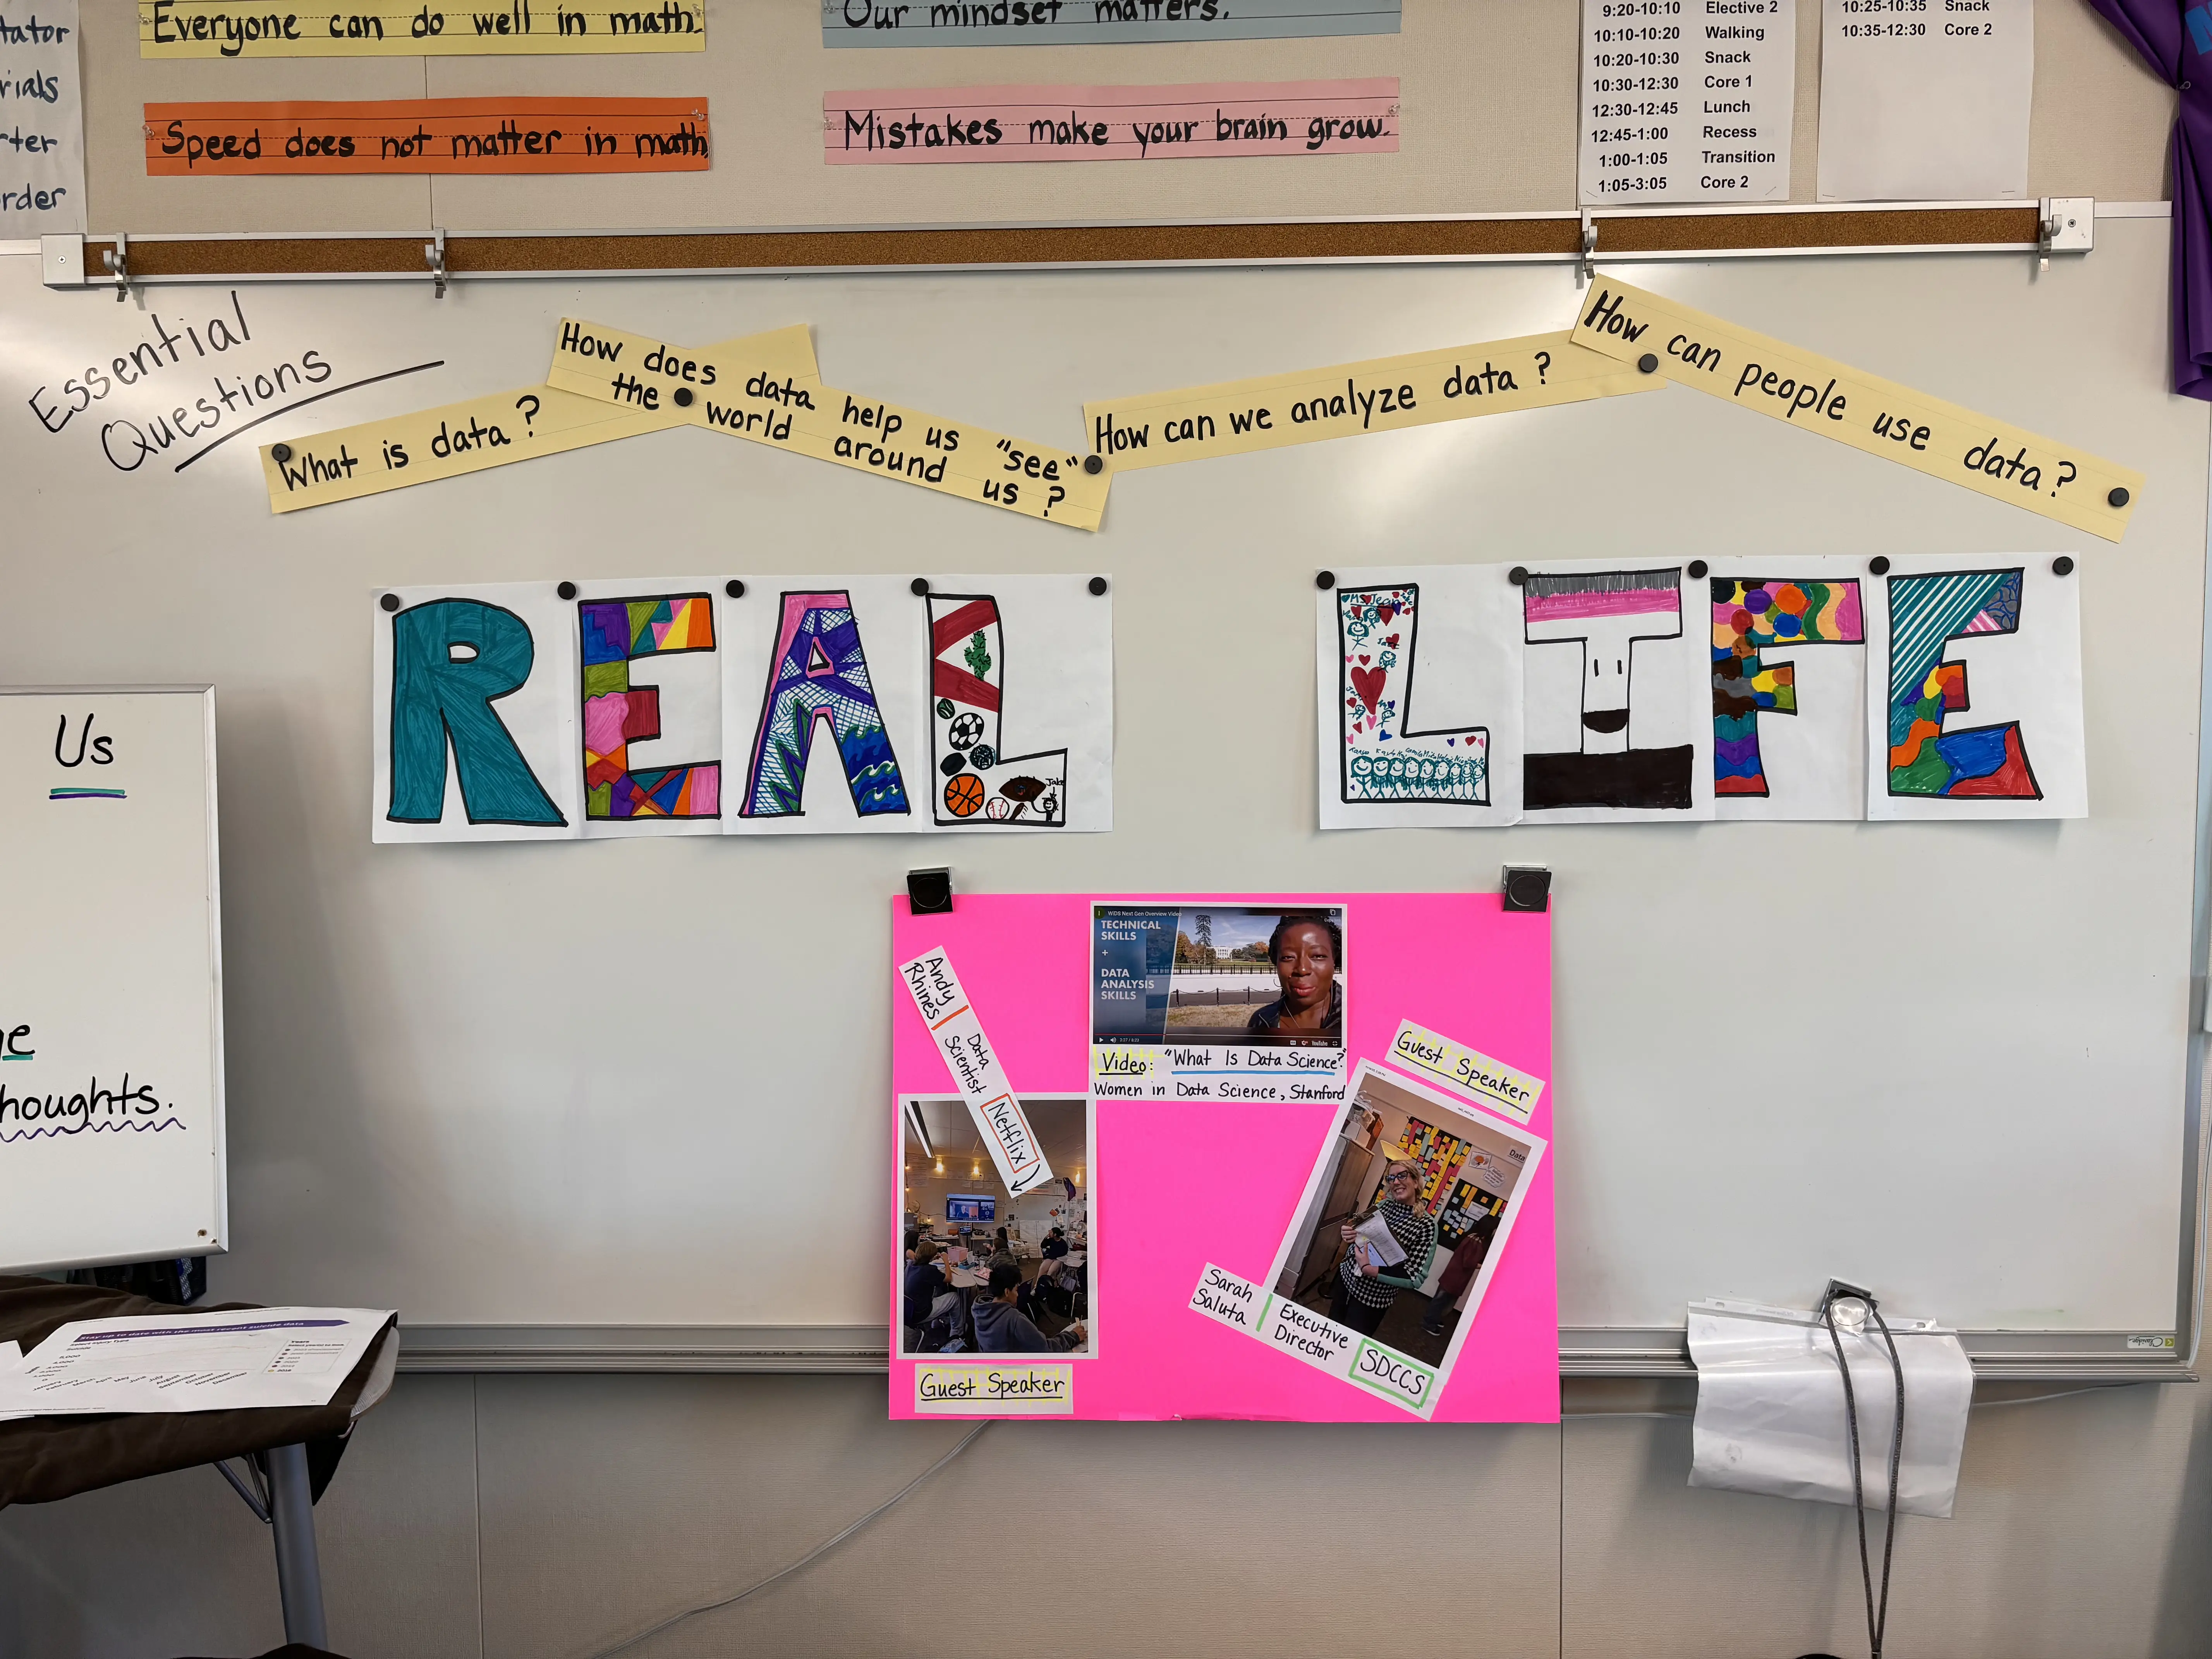
Essential Questions
- What is data?
- How does data help us “see” the world around us?
- How can people use data?
- How can we analyze data?
Content Standards
8th grade associations in data:
- Bivariate scatter plots (numerical data)
- Line of best fit
- Bivariate two-way tables (categorical data)
- Frequency and relative frequency
- Bivariate side-by-side bar graphs and segmented bar graphs
Products
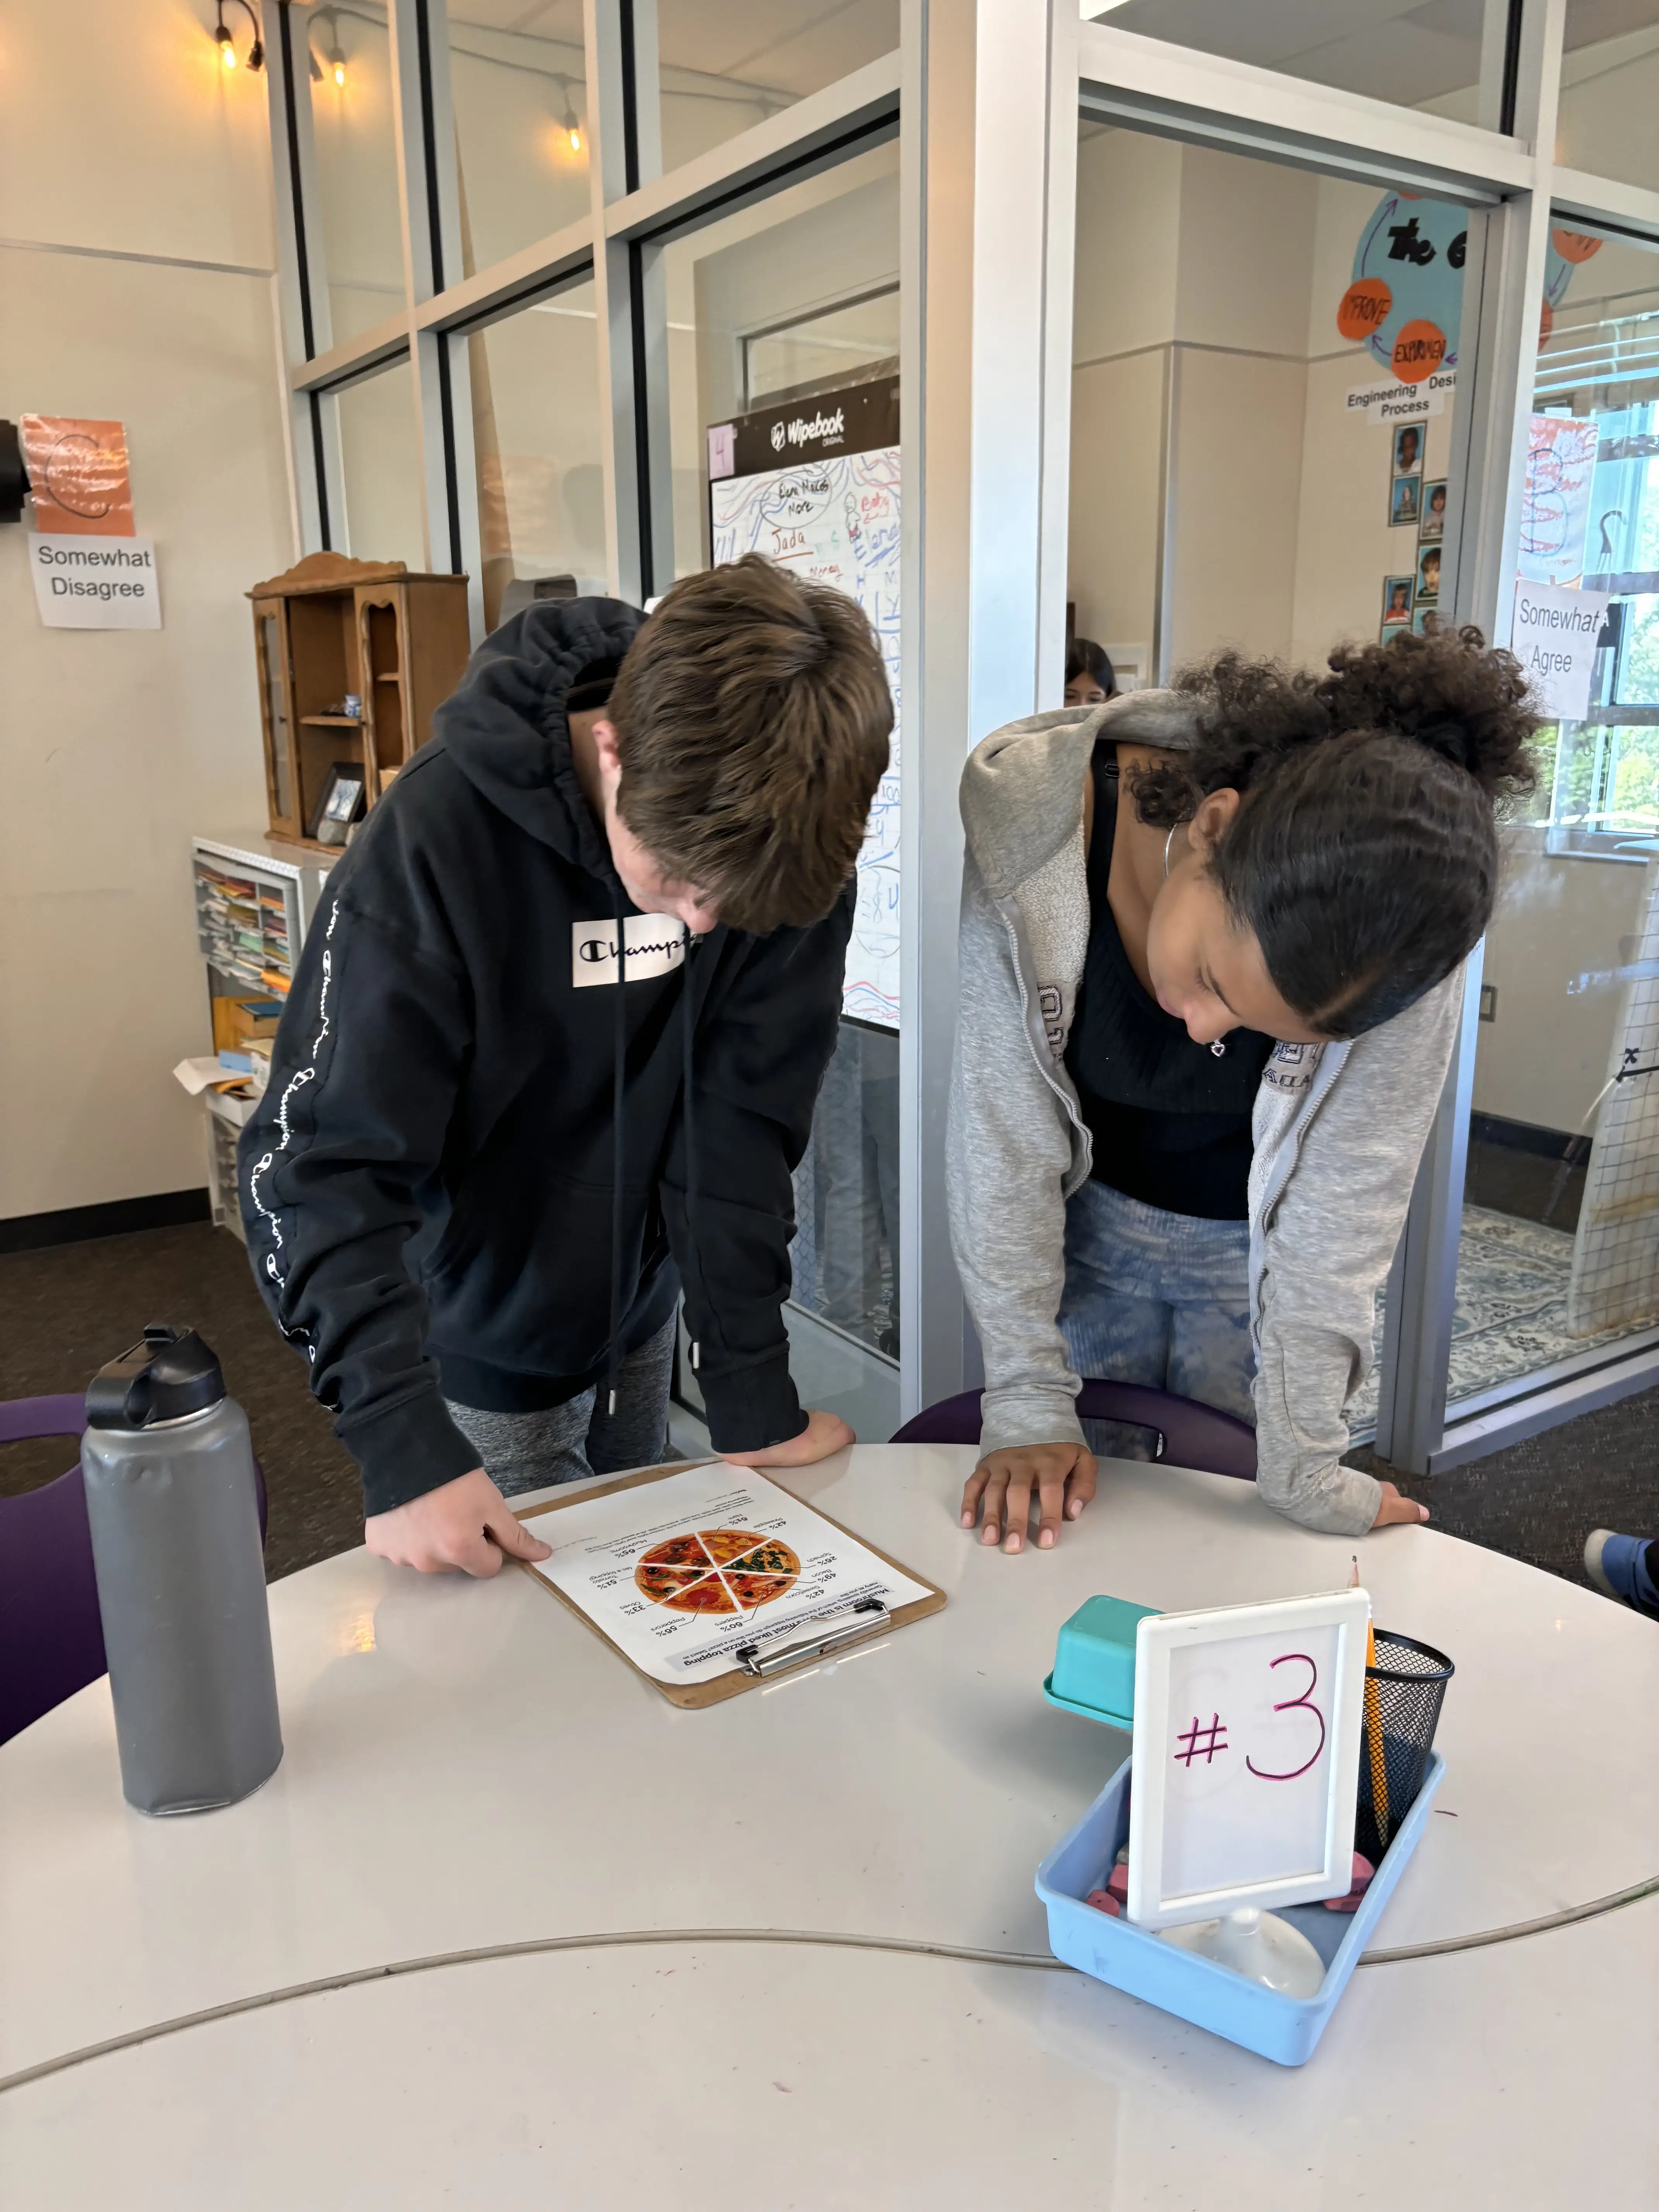
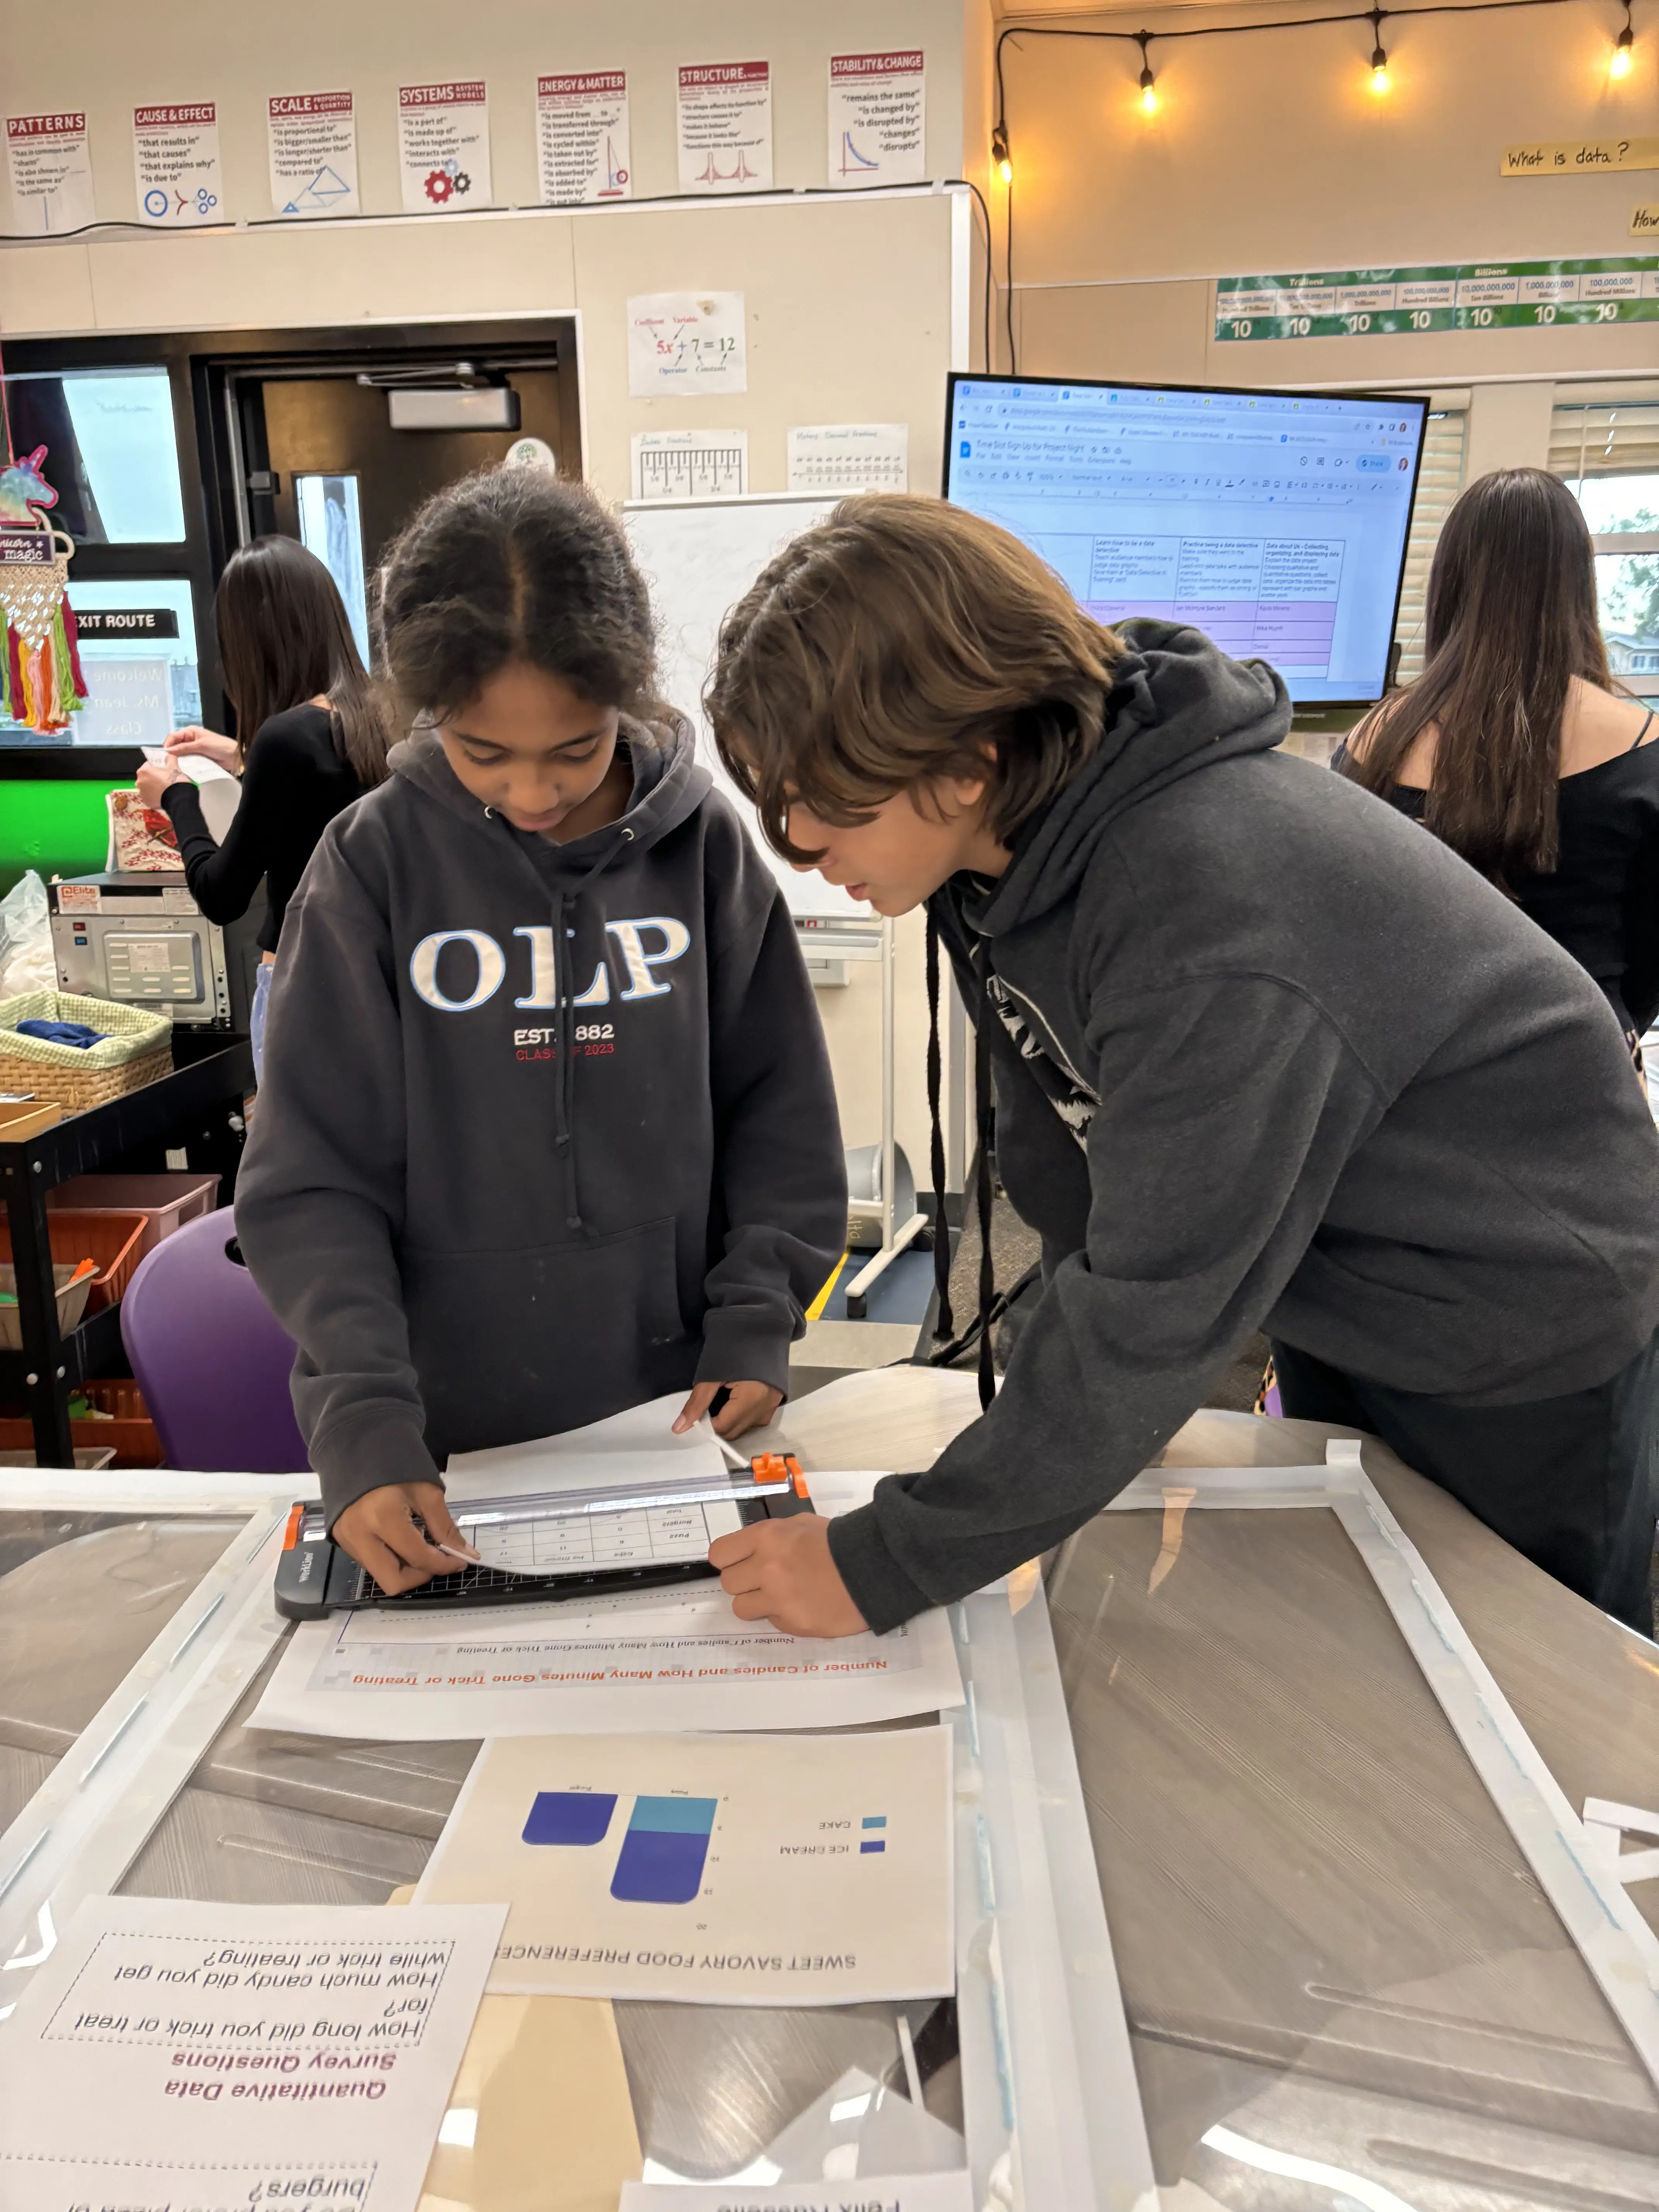
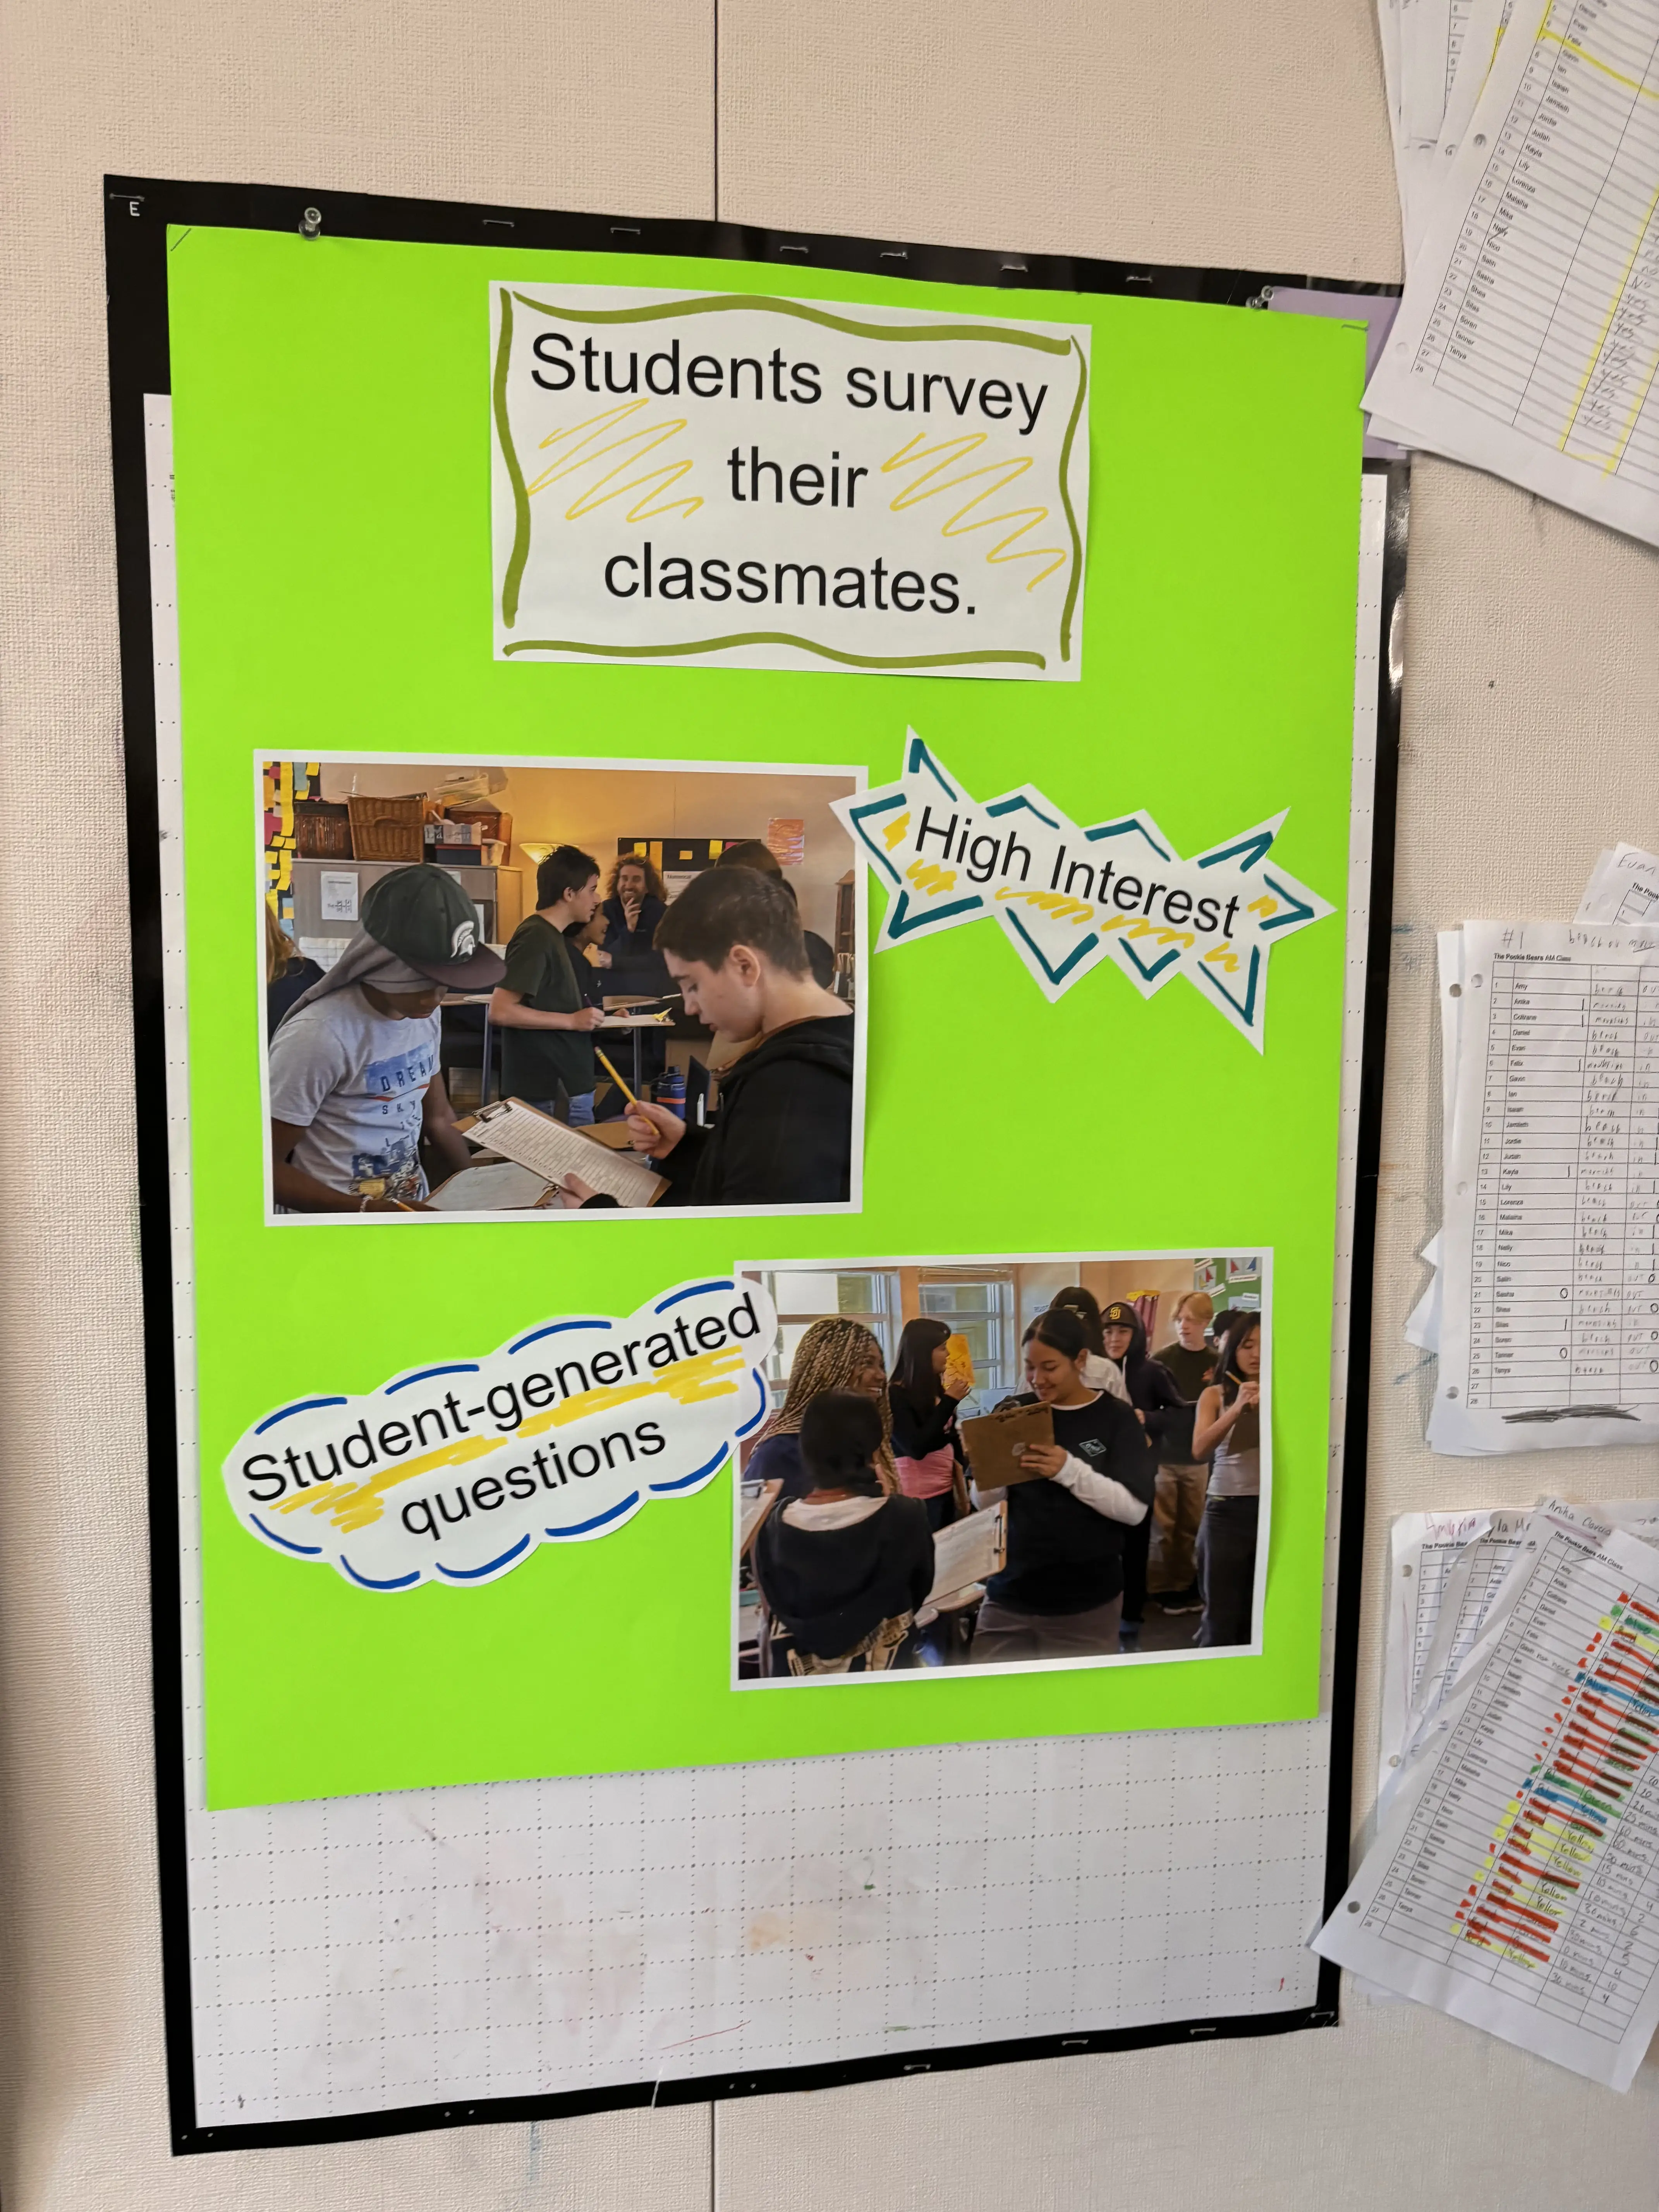
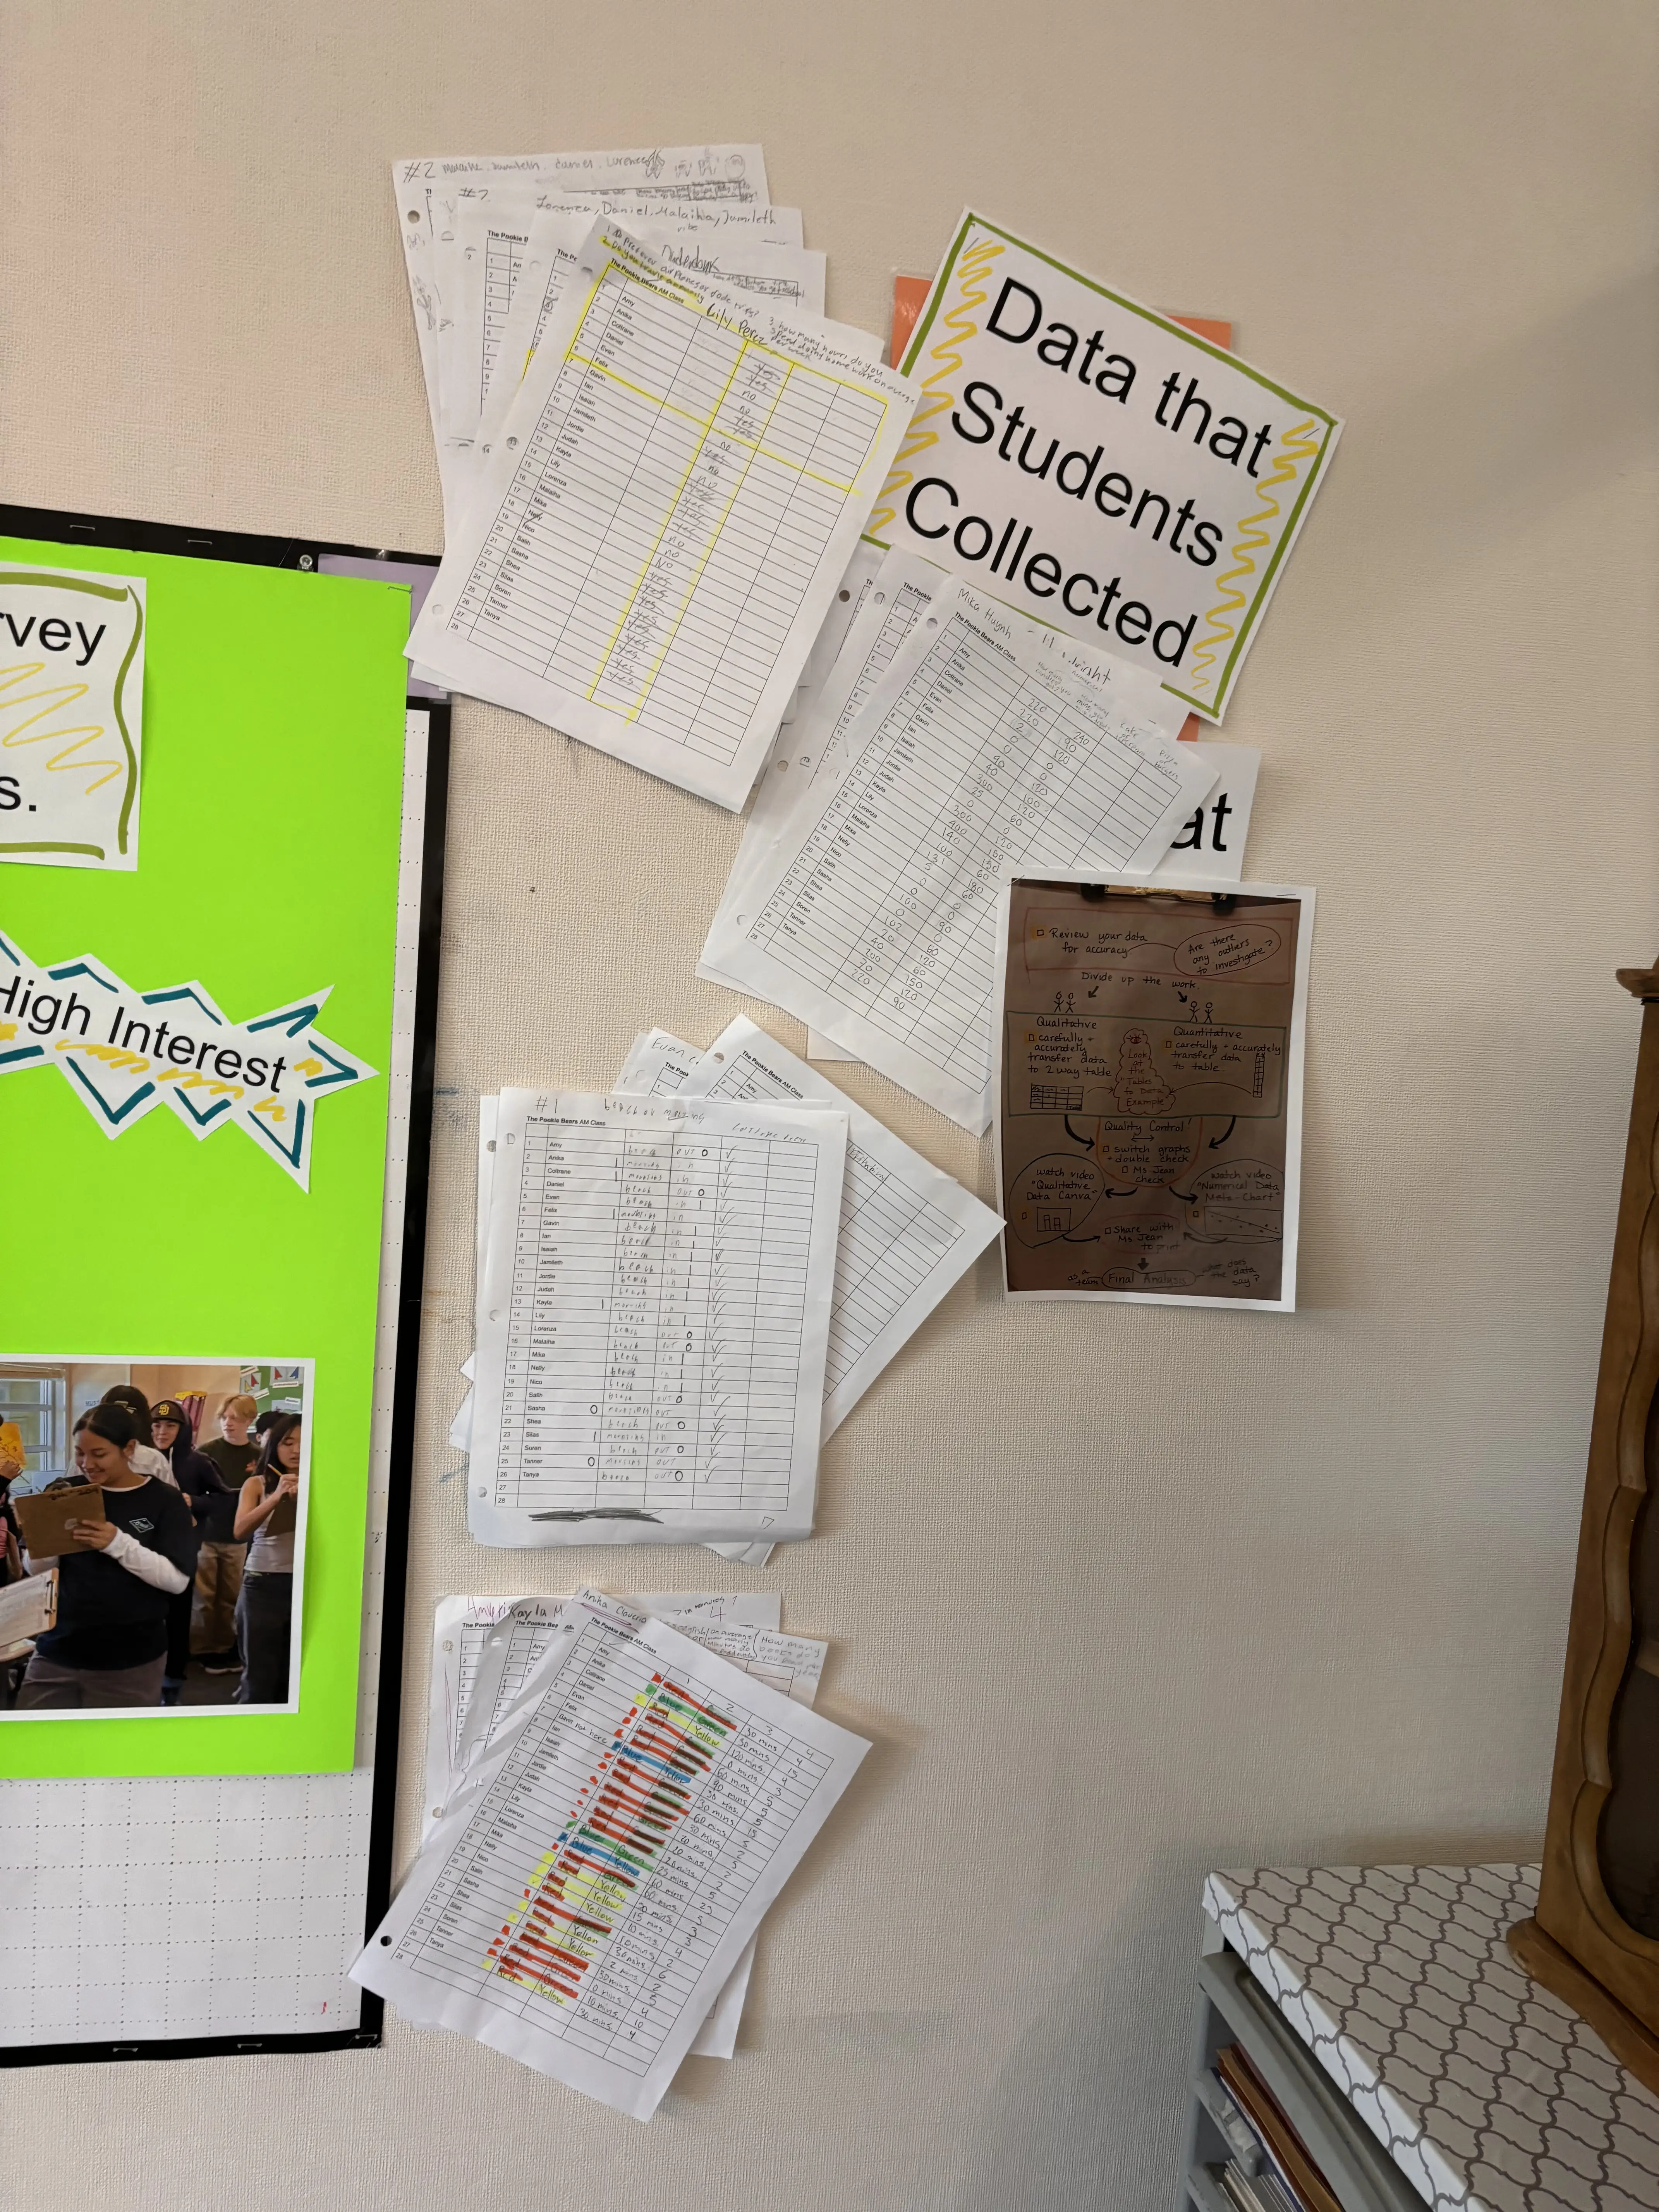
- Groups of four write two categorical questions and two numerical questions, anticipating that each pair of questions are correlated. They poll all classmates and organize their data by creating a scatter plot, two-way frequency table, and side-by-side bar graph or segmented bar graph. Finally, they analyze the association of the data and present their findings at project night.
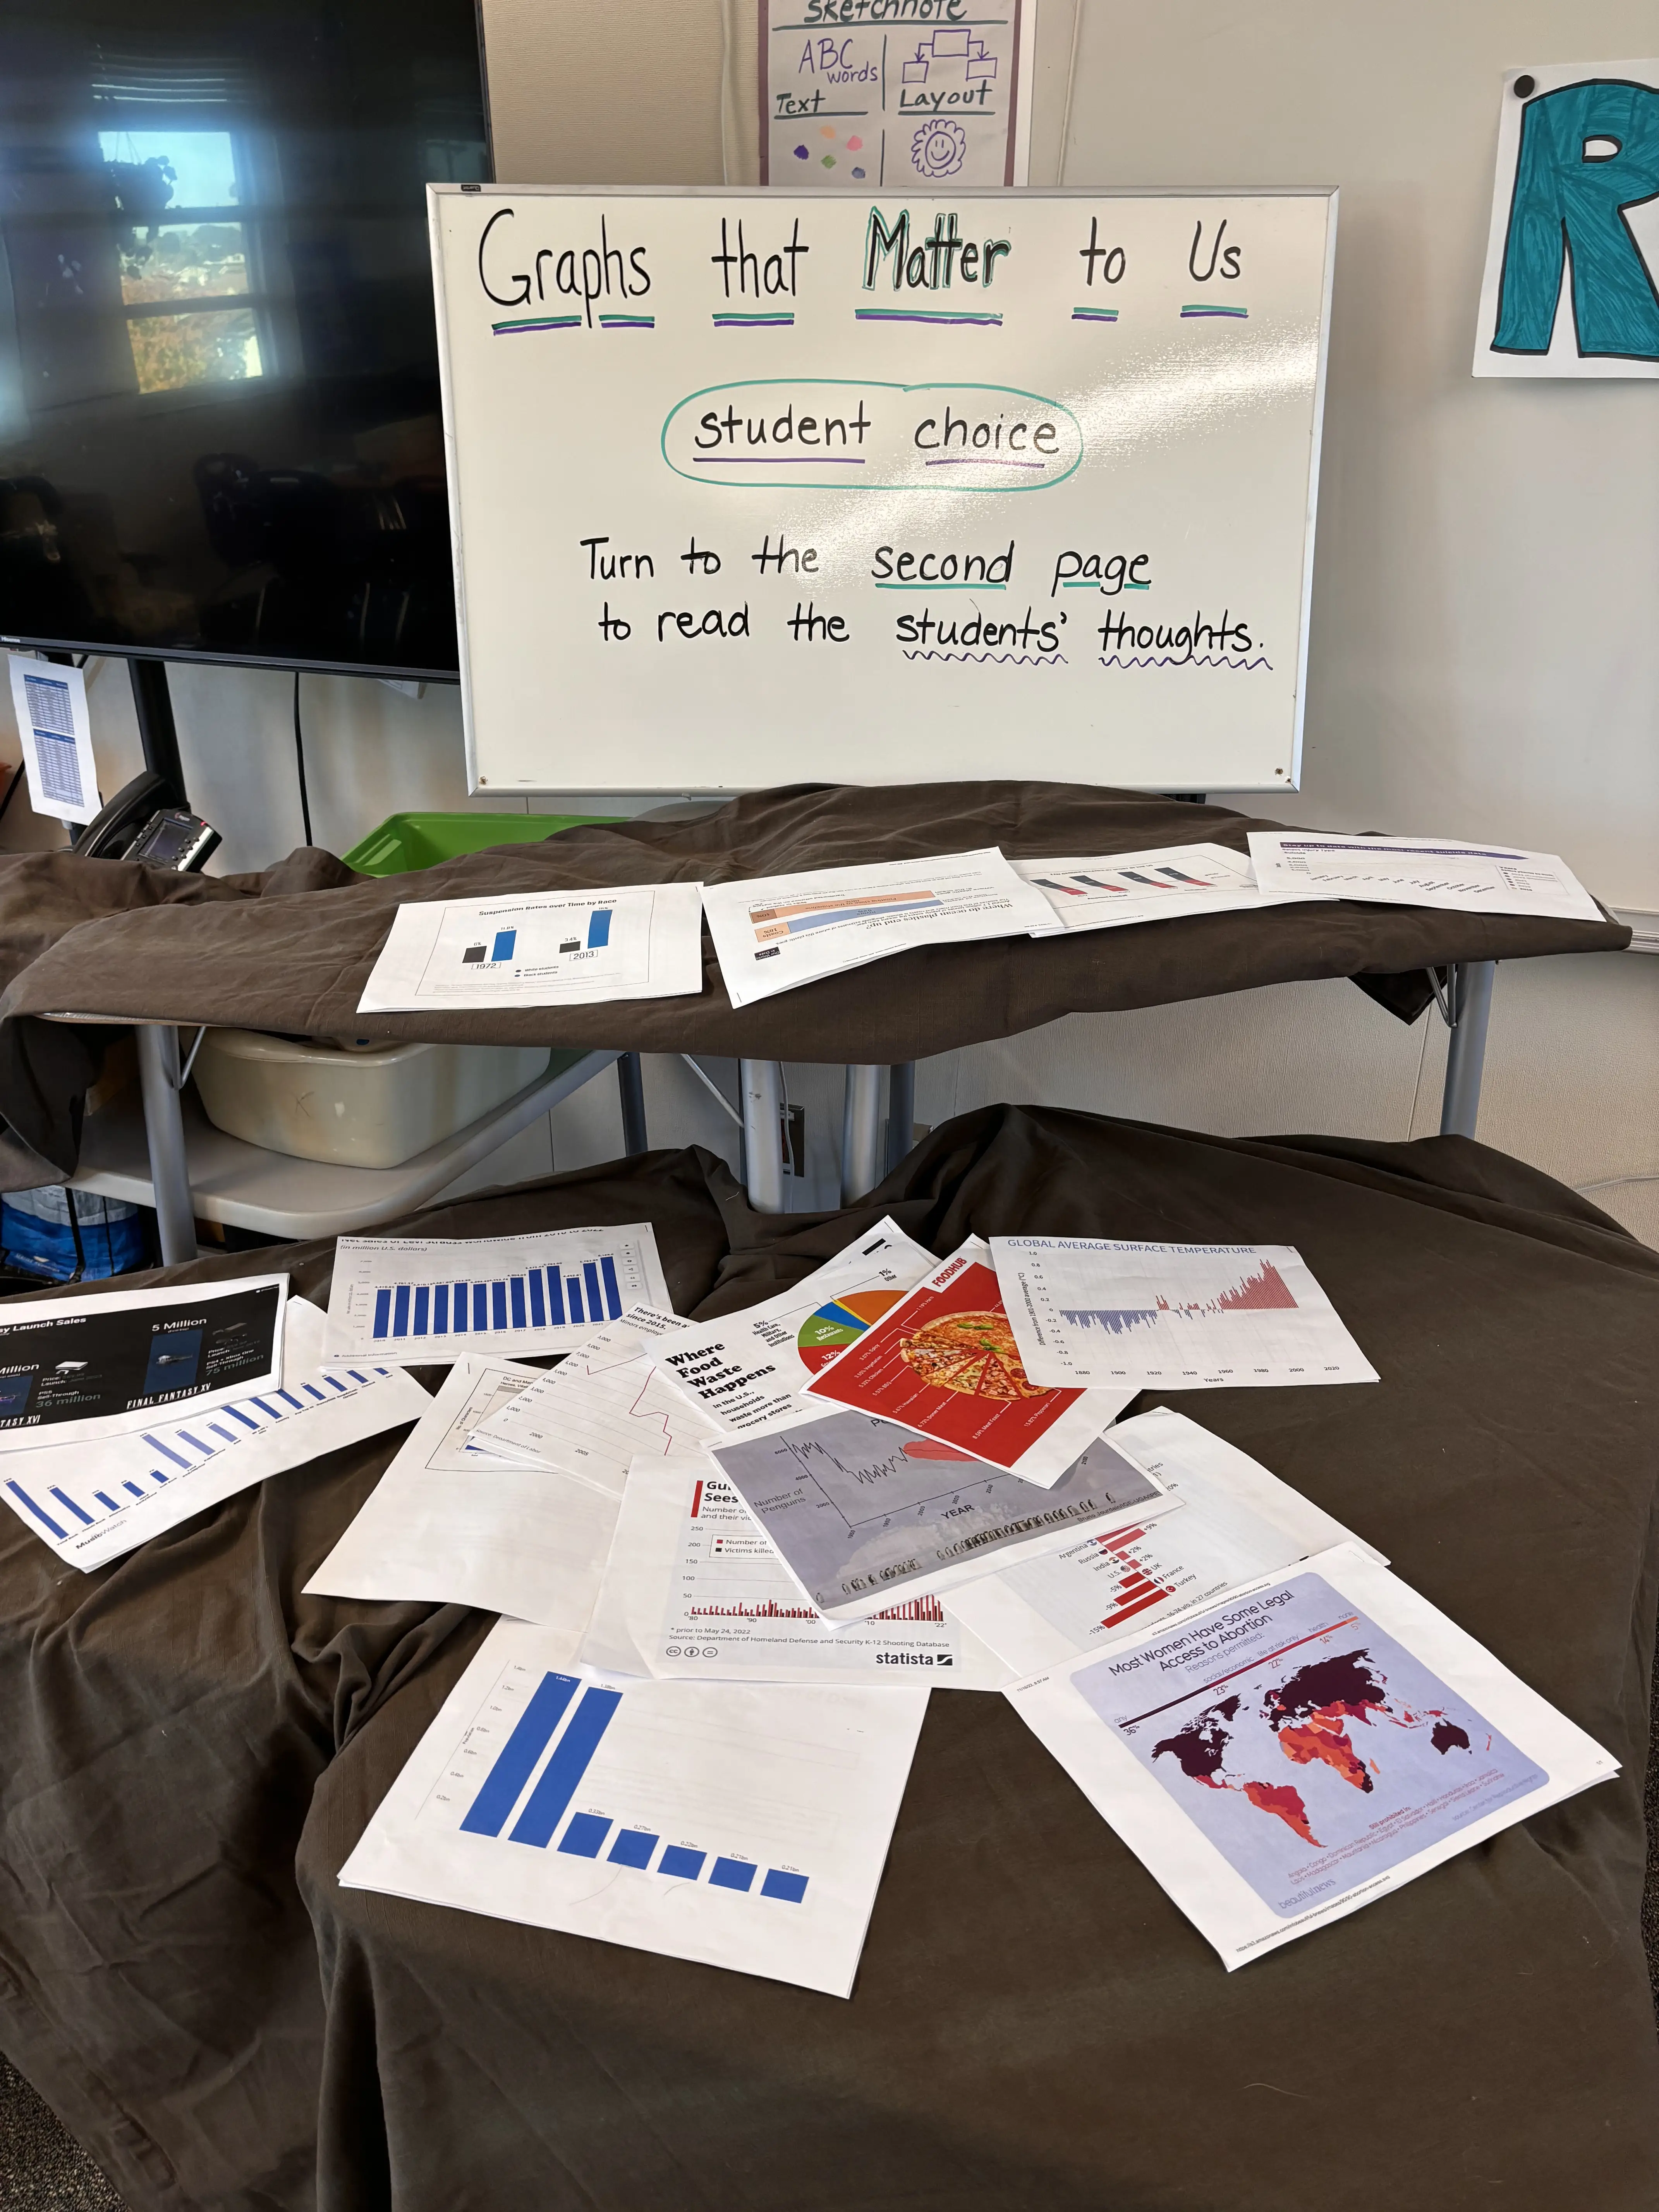
- “Graphs that Mean Something to Me” - In this extension activity, students research to find a representation of data that means something to them. They share why the graph is important to them, judge the source, and interpret what the data is telling us.
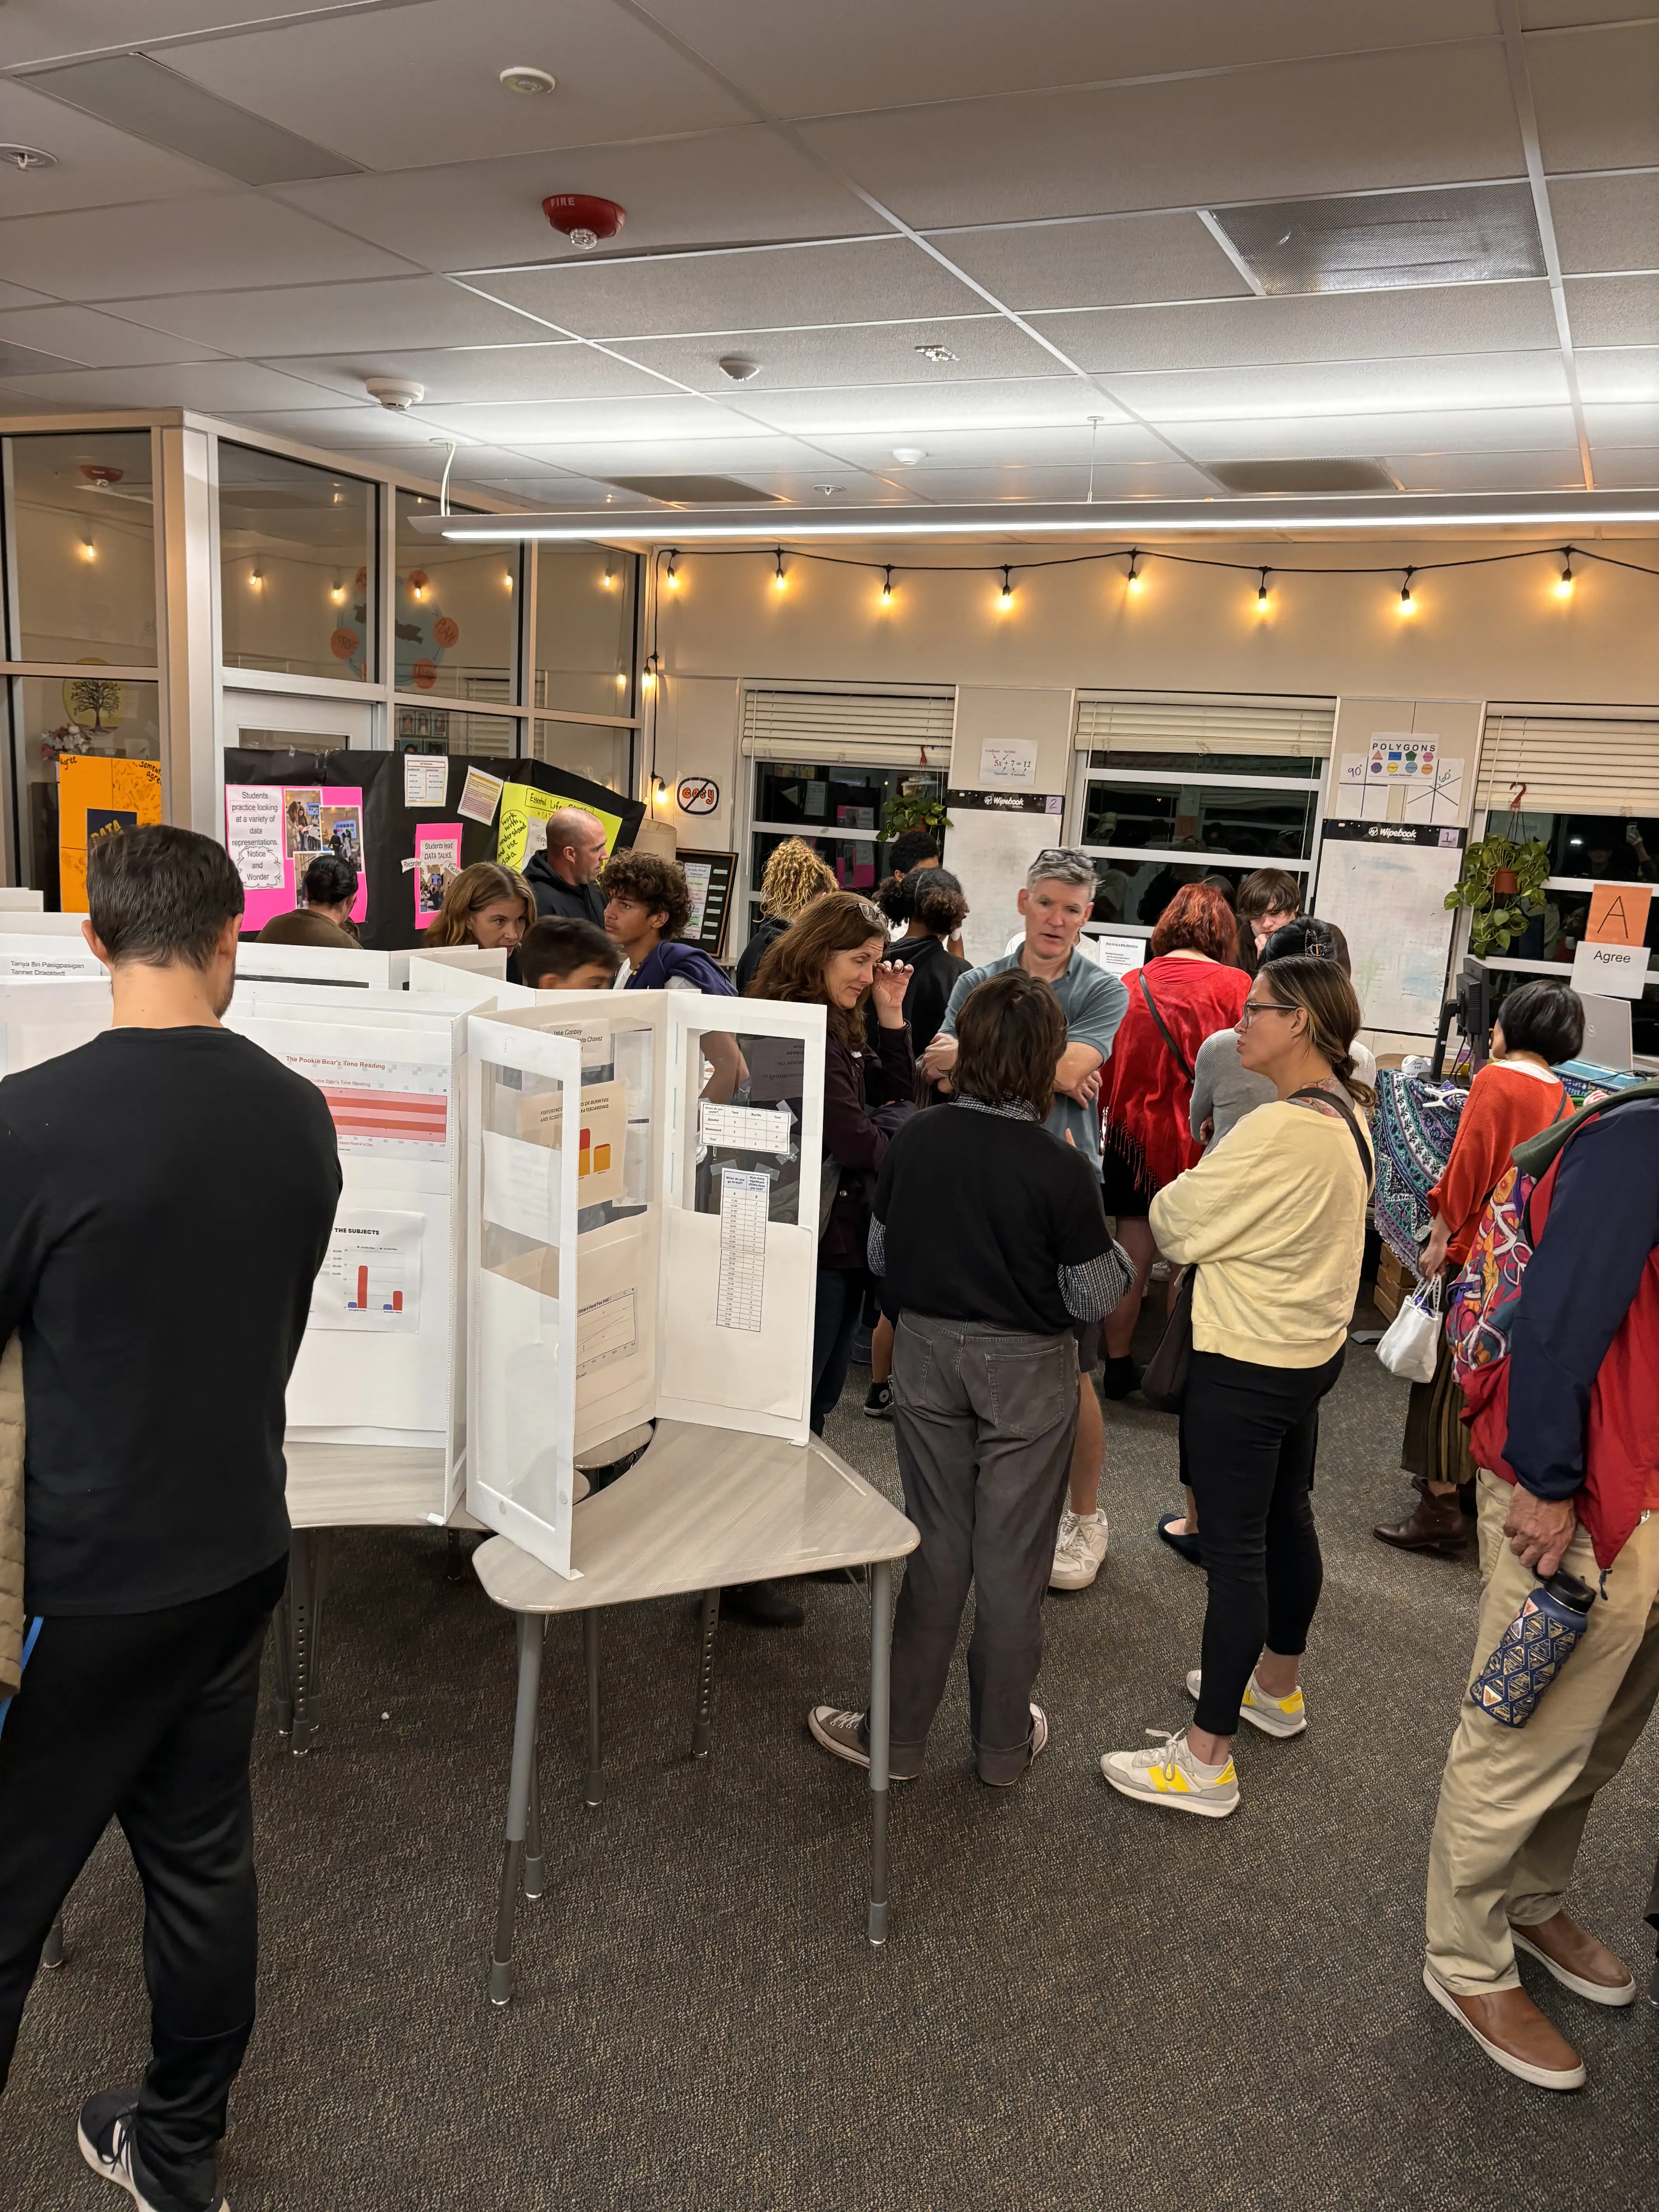
Exhibition
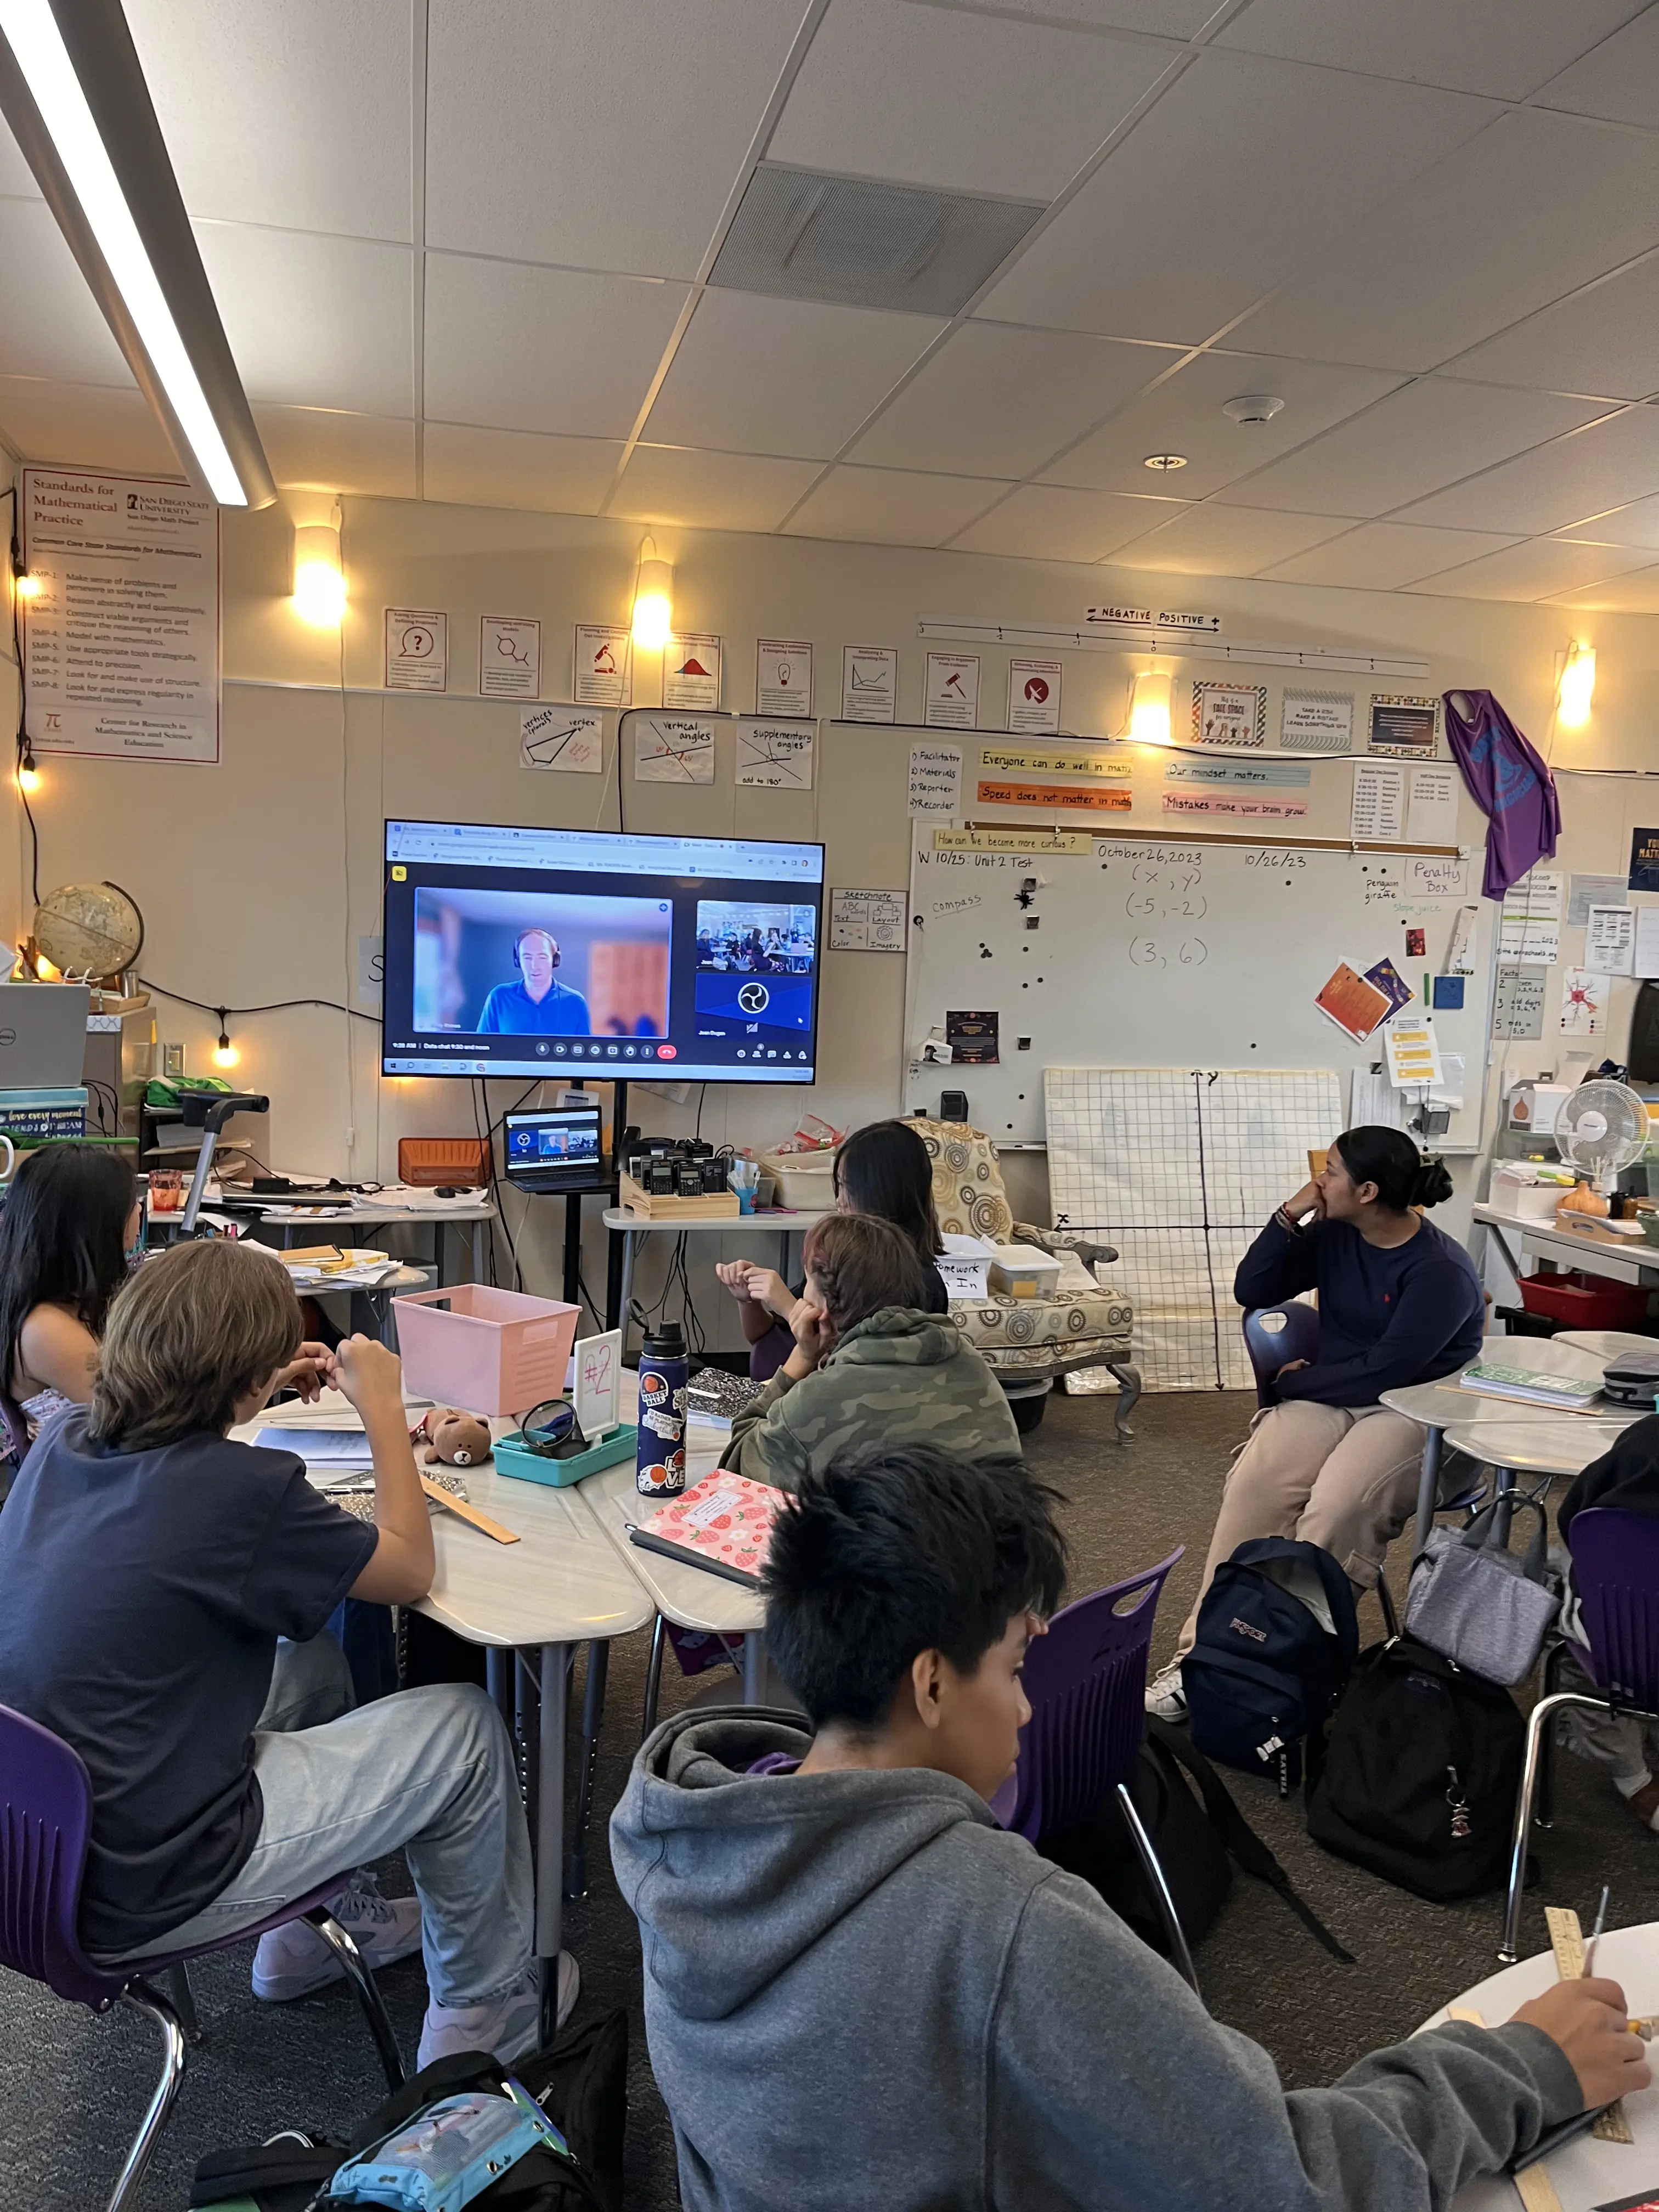
Students host project night by signing up to work for 30 minutes at one of these tasks:
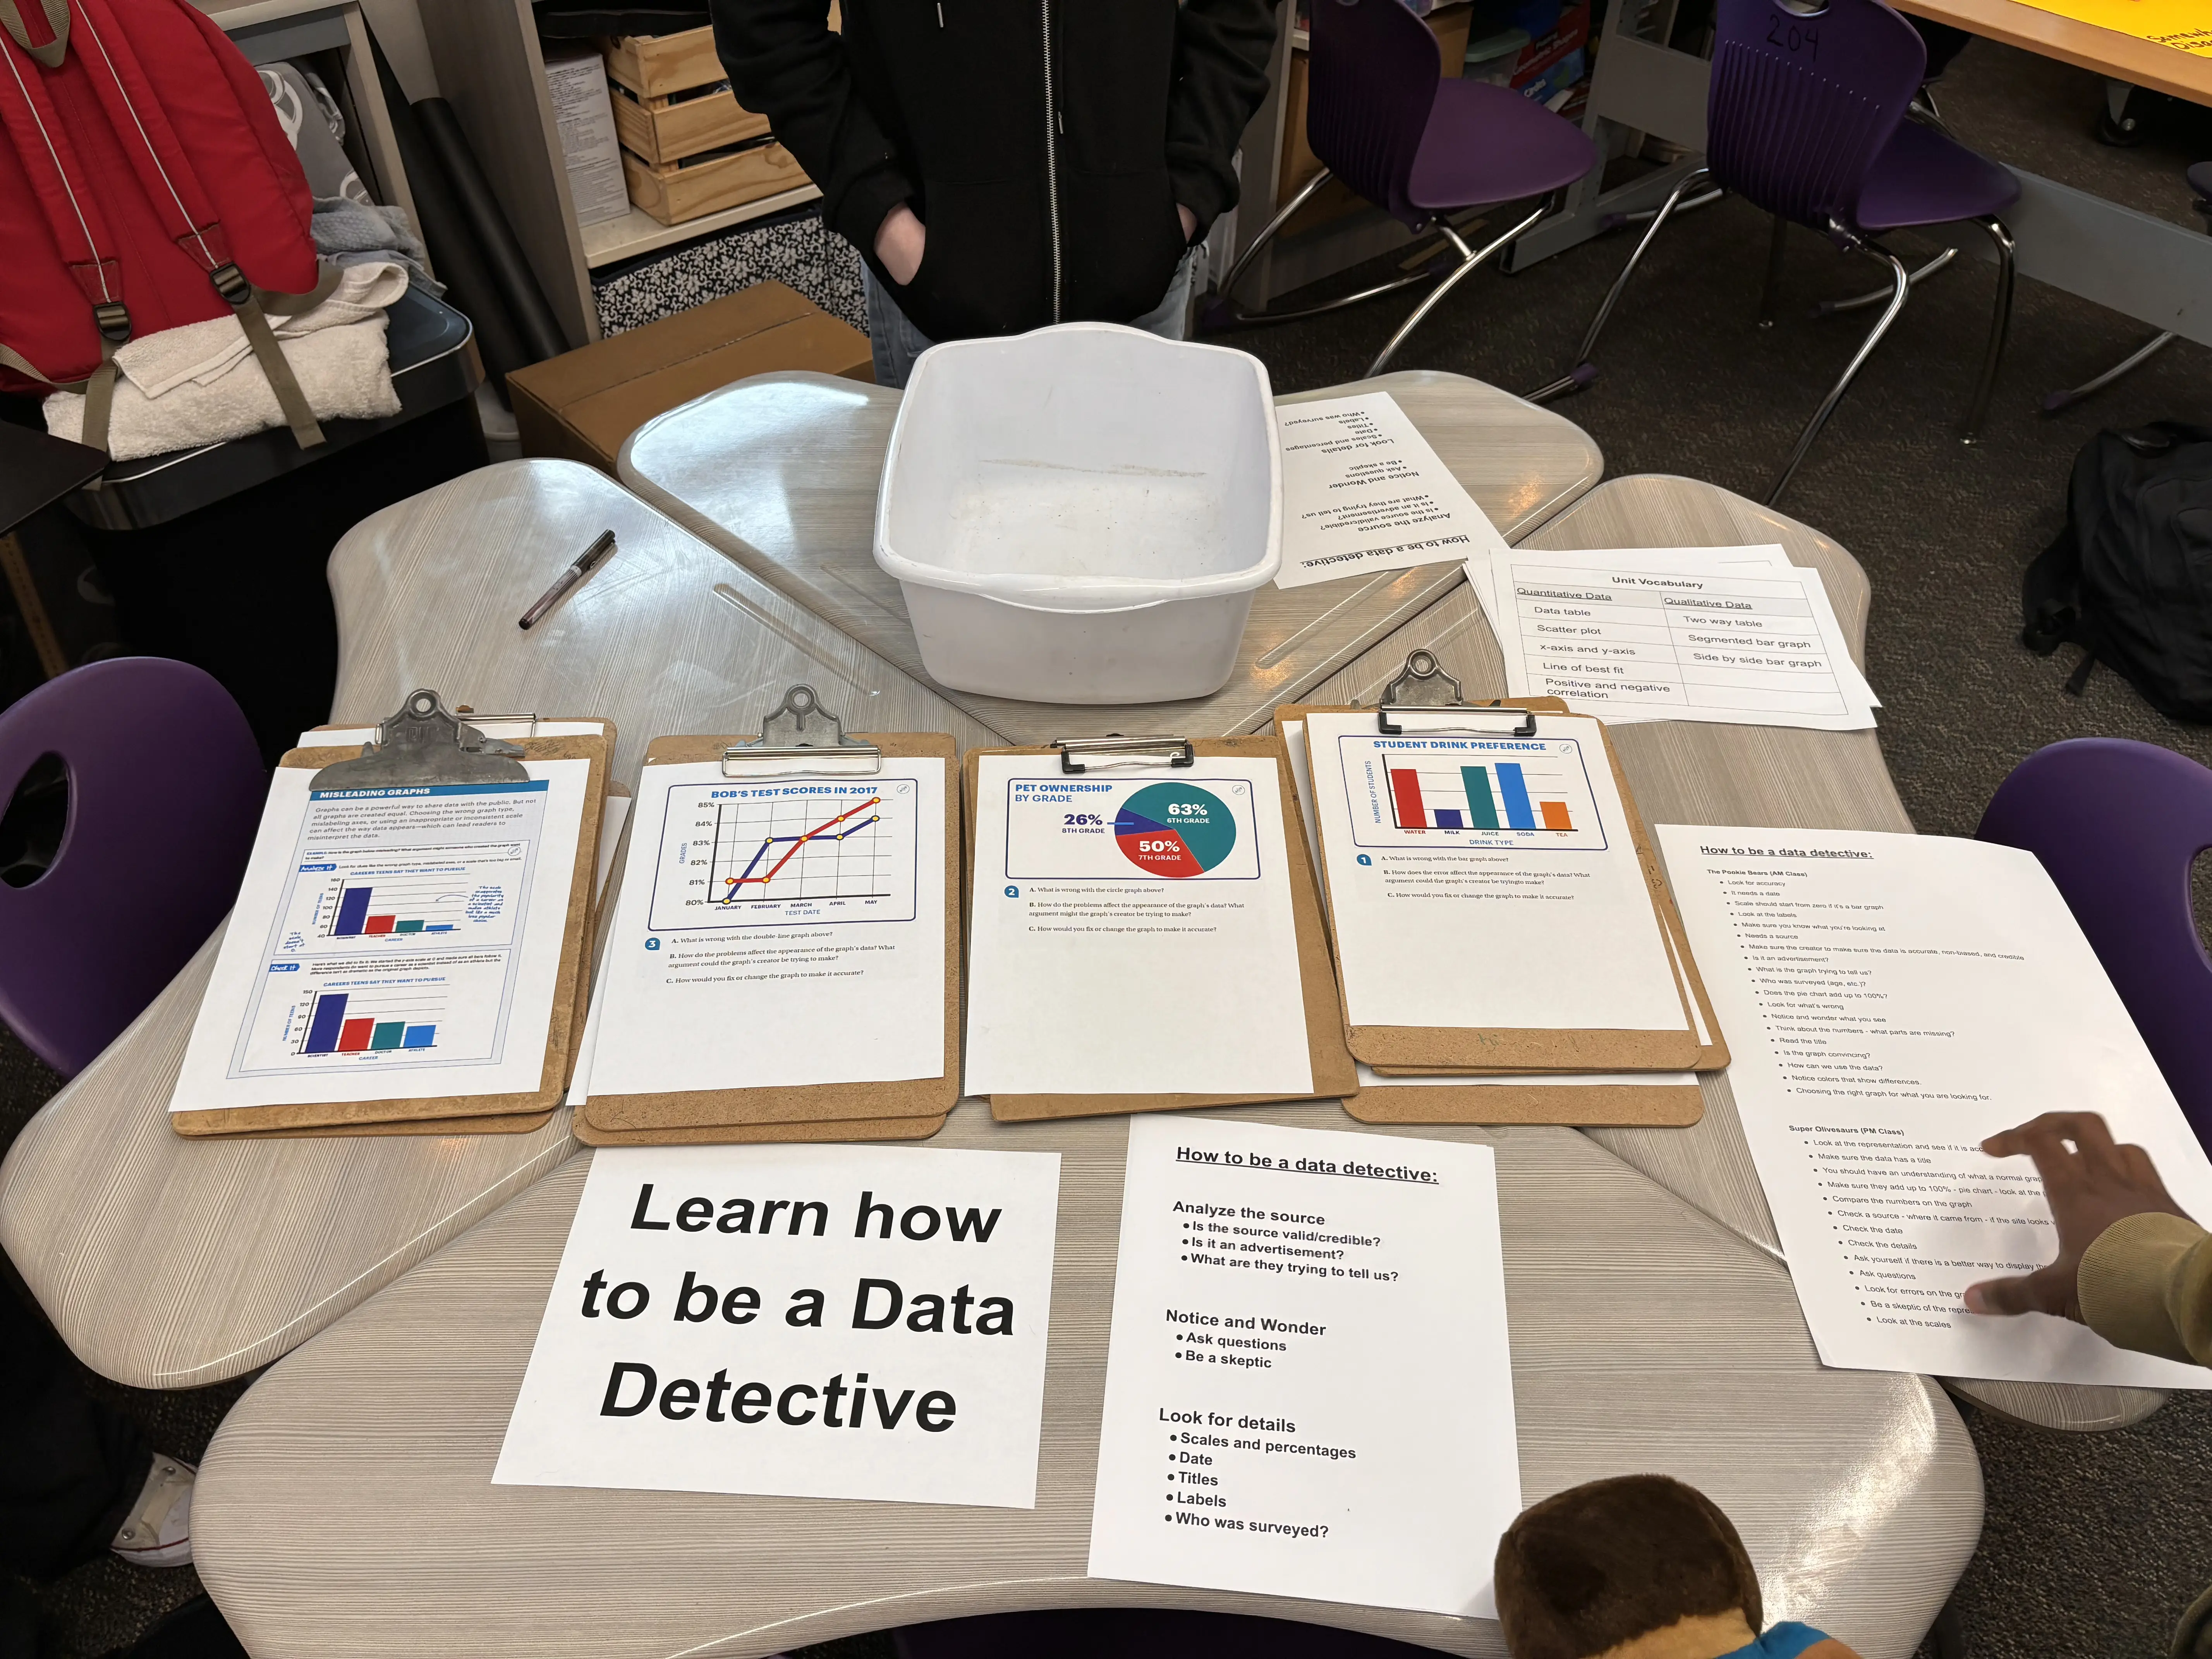
Learn how to be a data detective
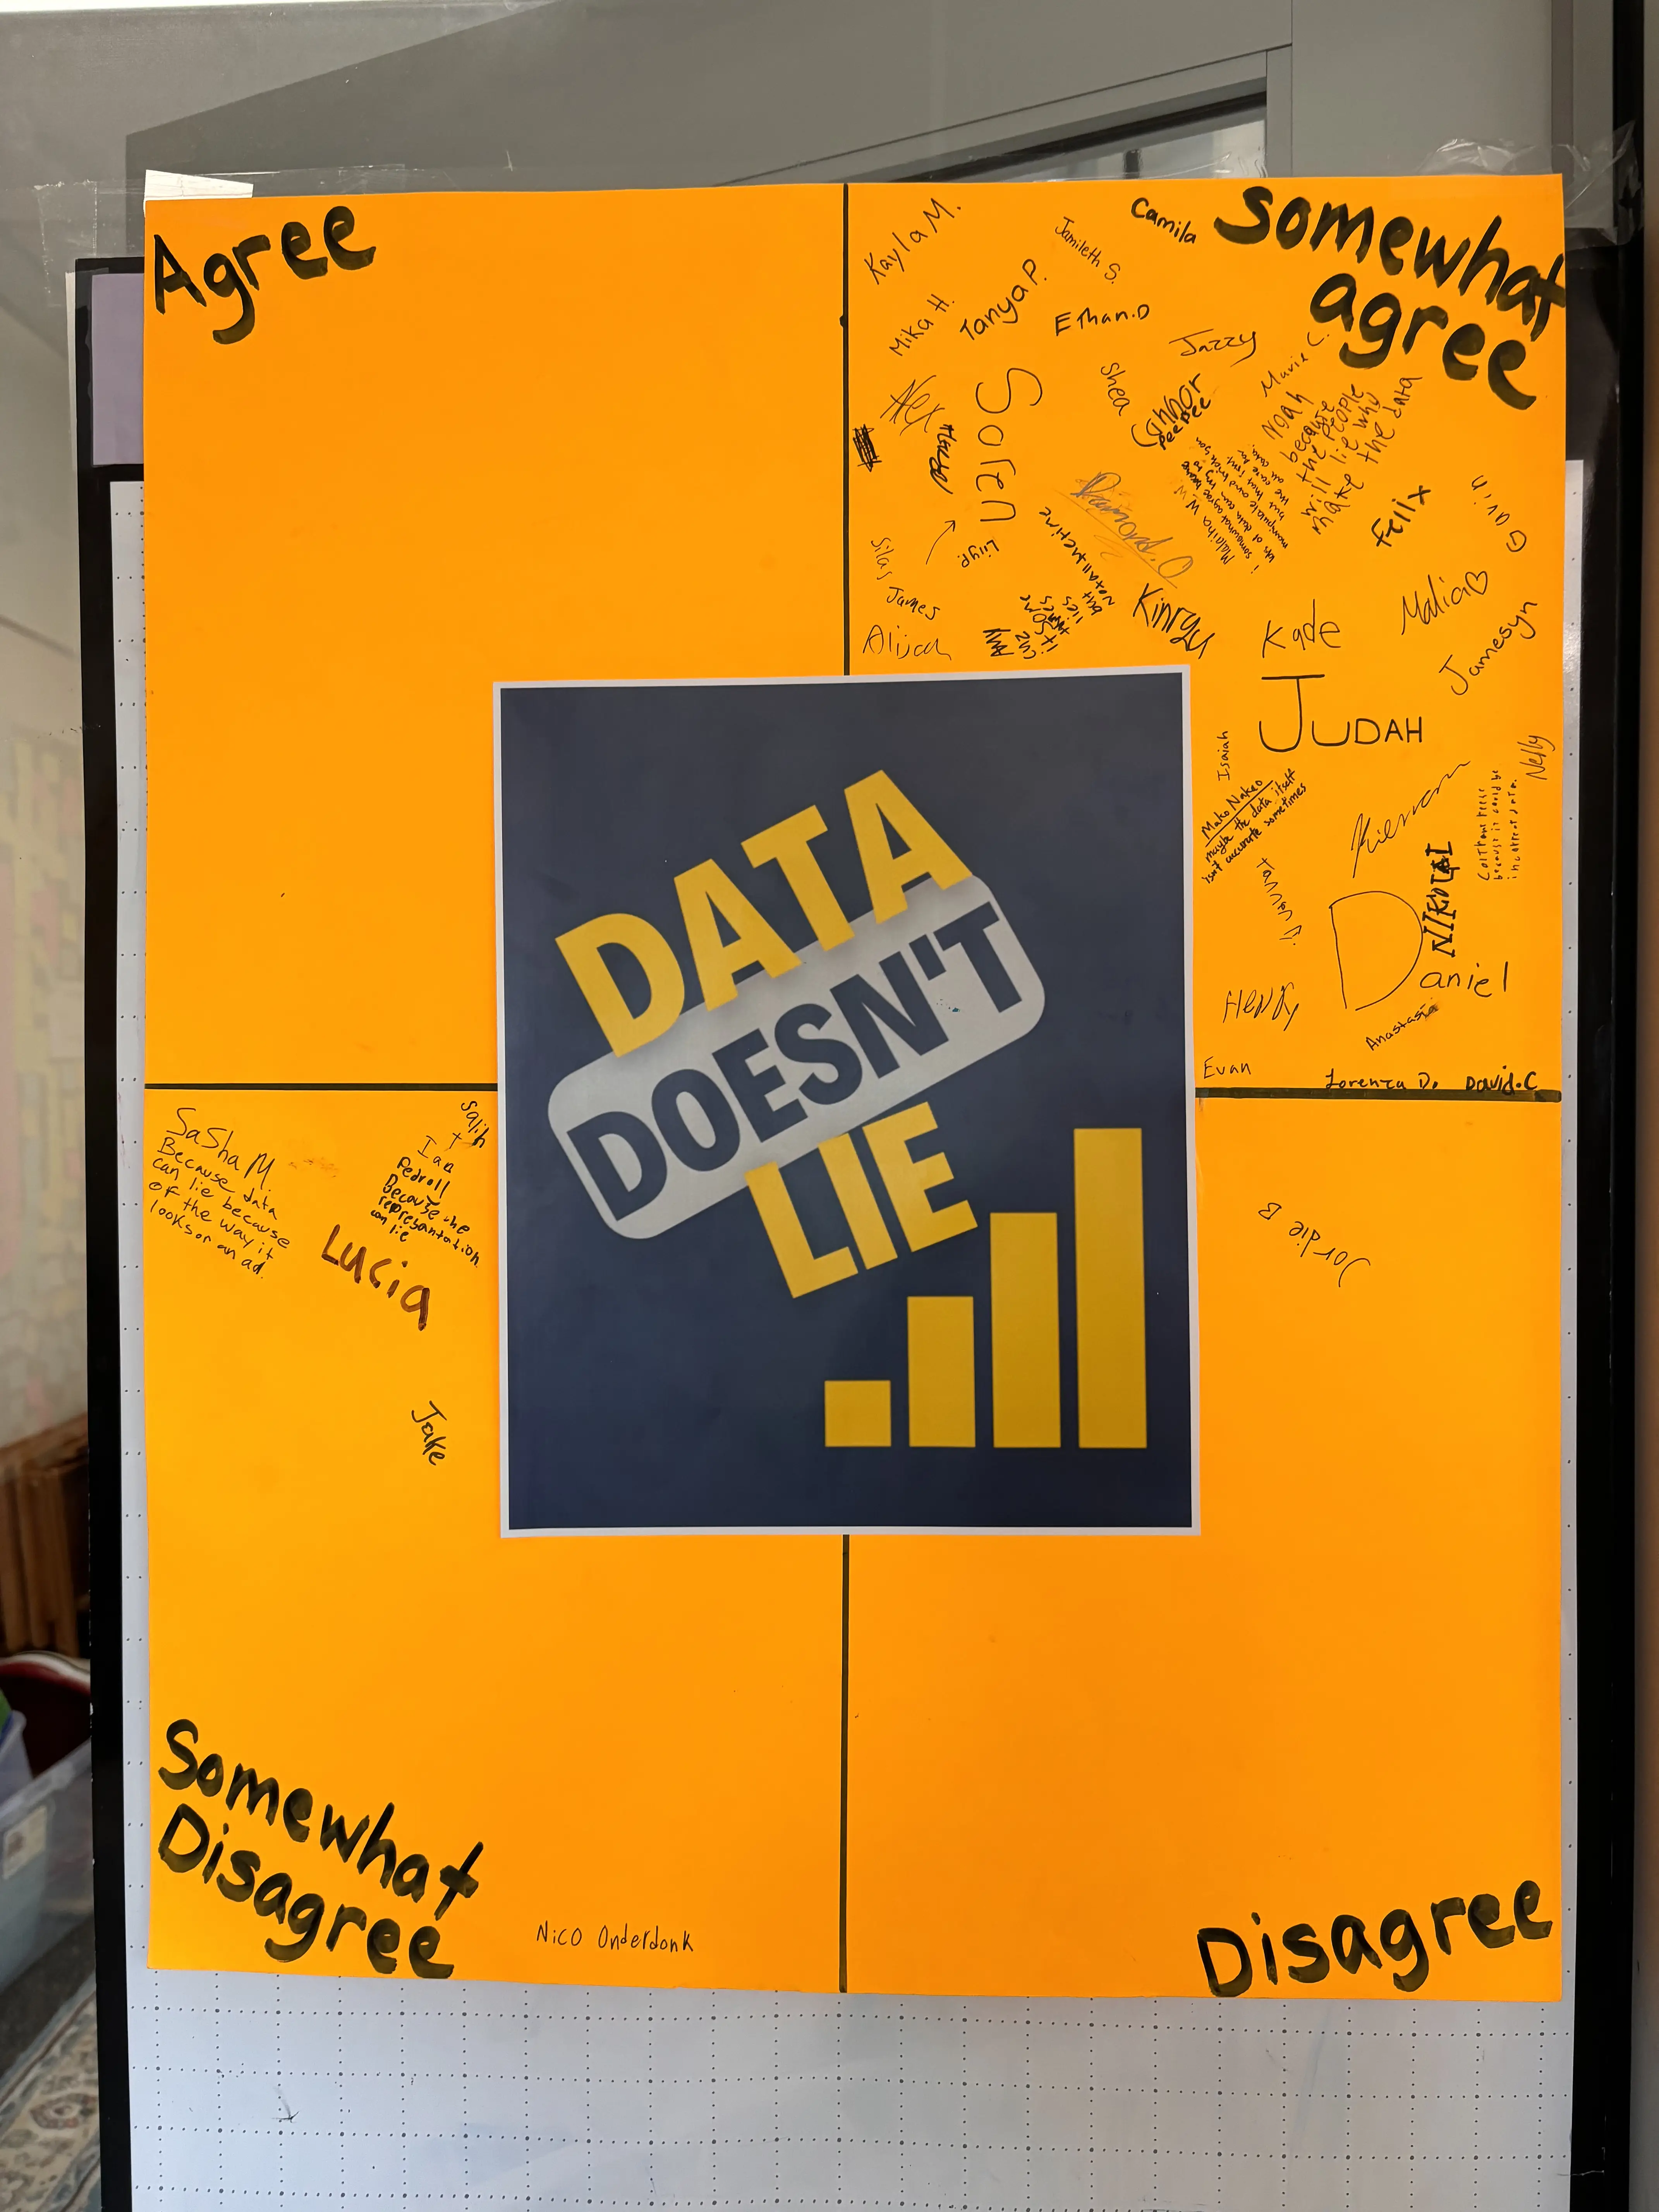
Teach audience members how to judge data graphs.
Give them a “Data Detective in Training” card.
Practice being a data detective
Make sure they went to the training.
Lead mini data talks with audience members.
Remind them how to judge data graphs - classify them as strong or TURDs (Truly Unfortunate Representations of Data)
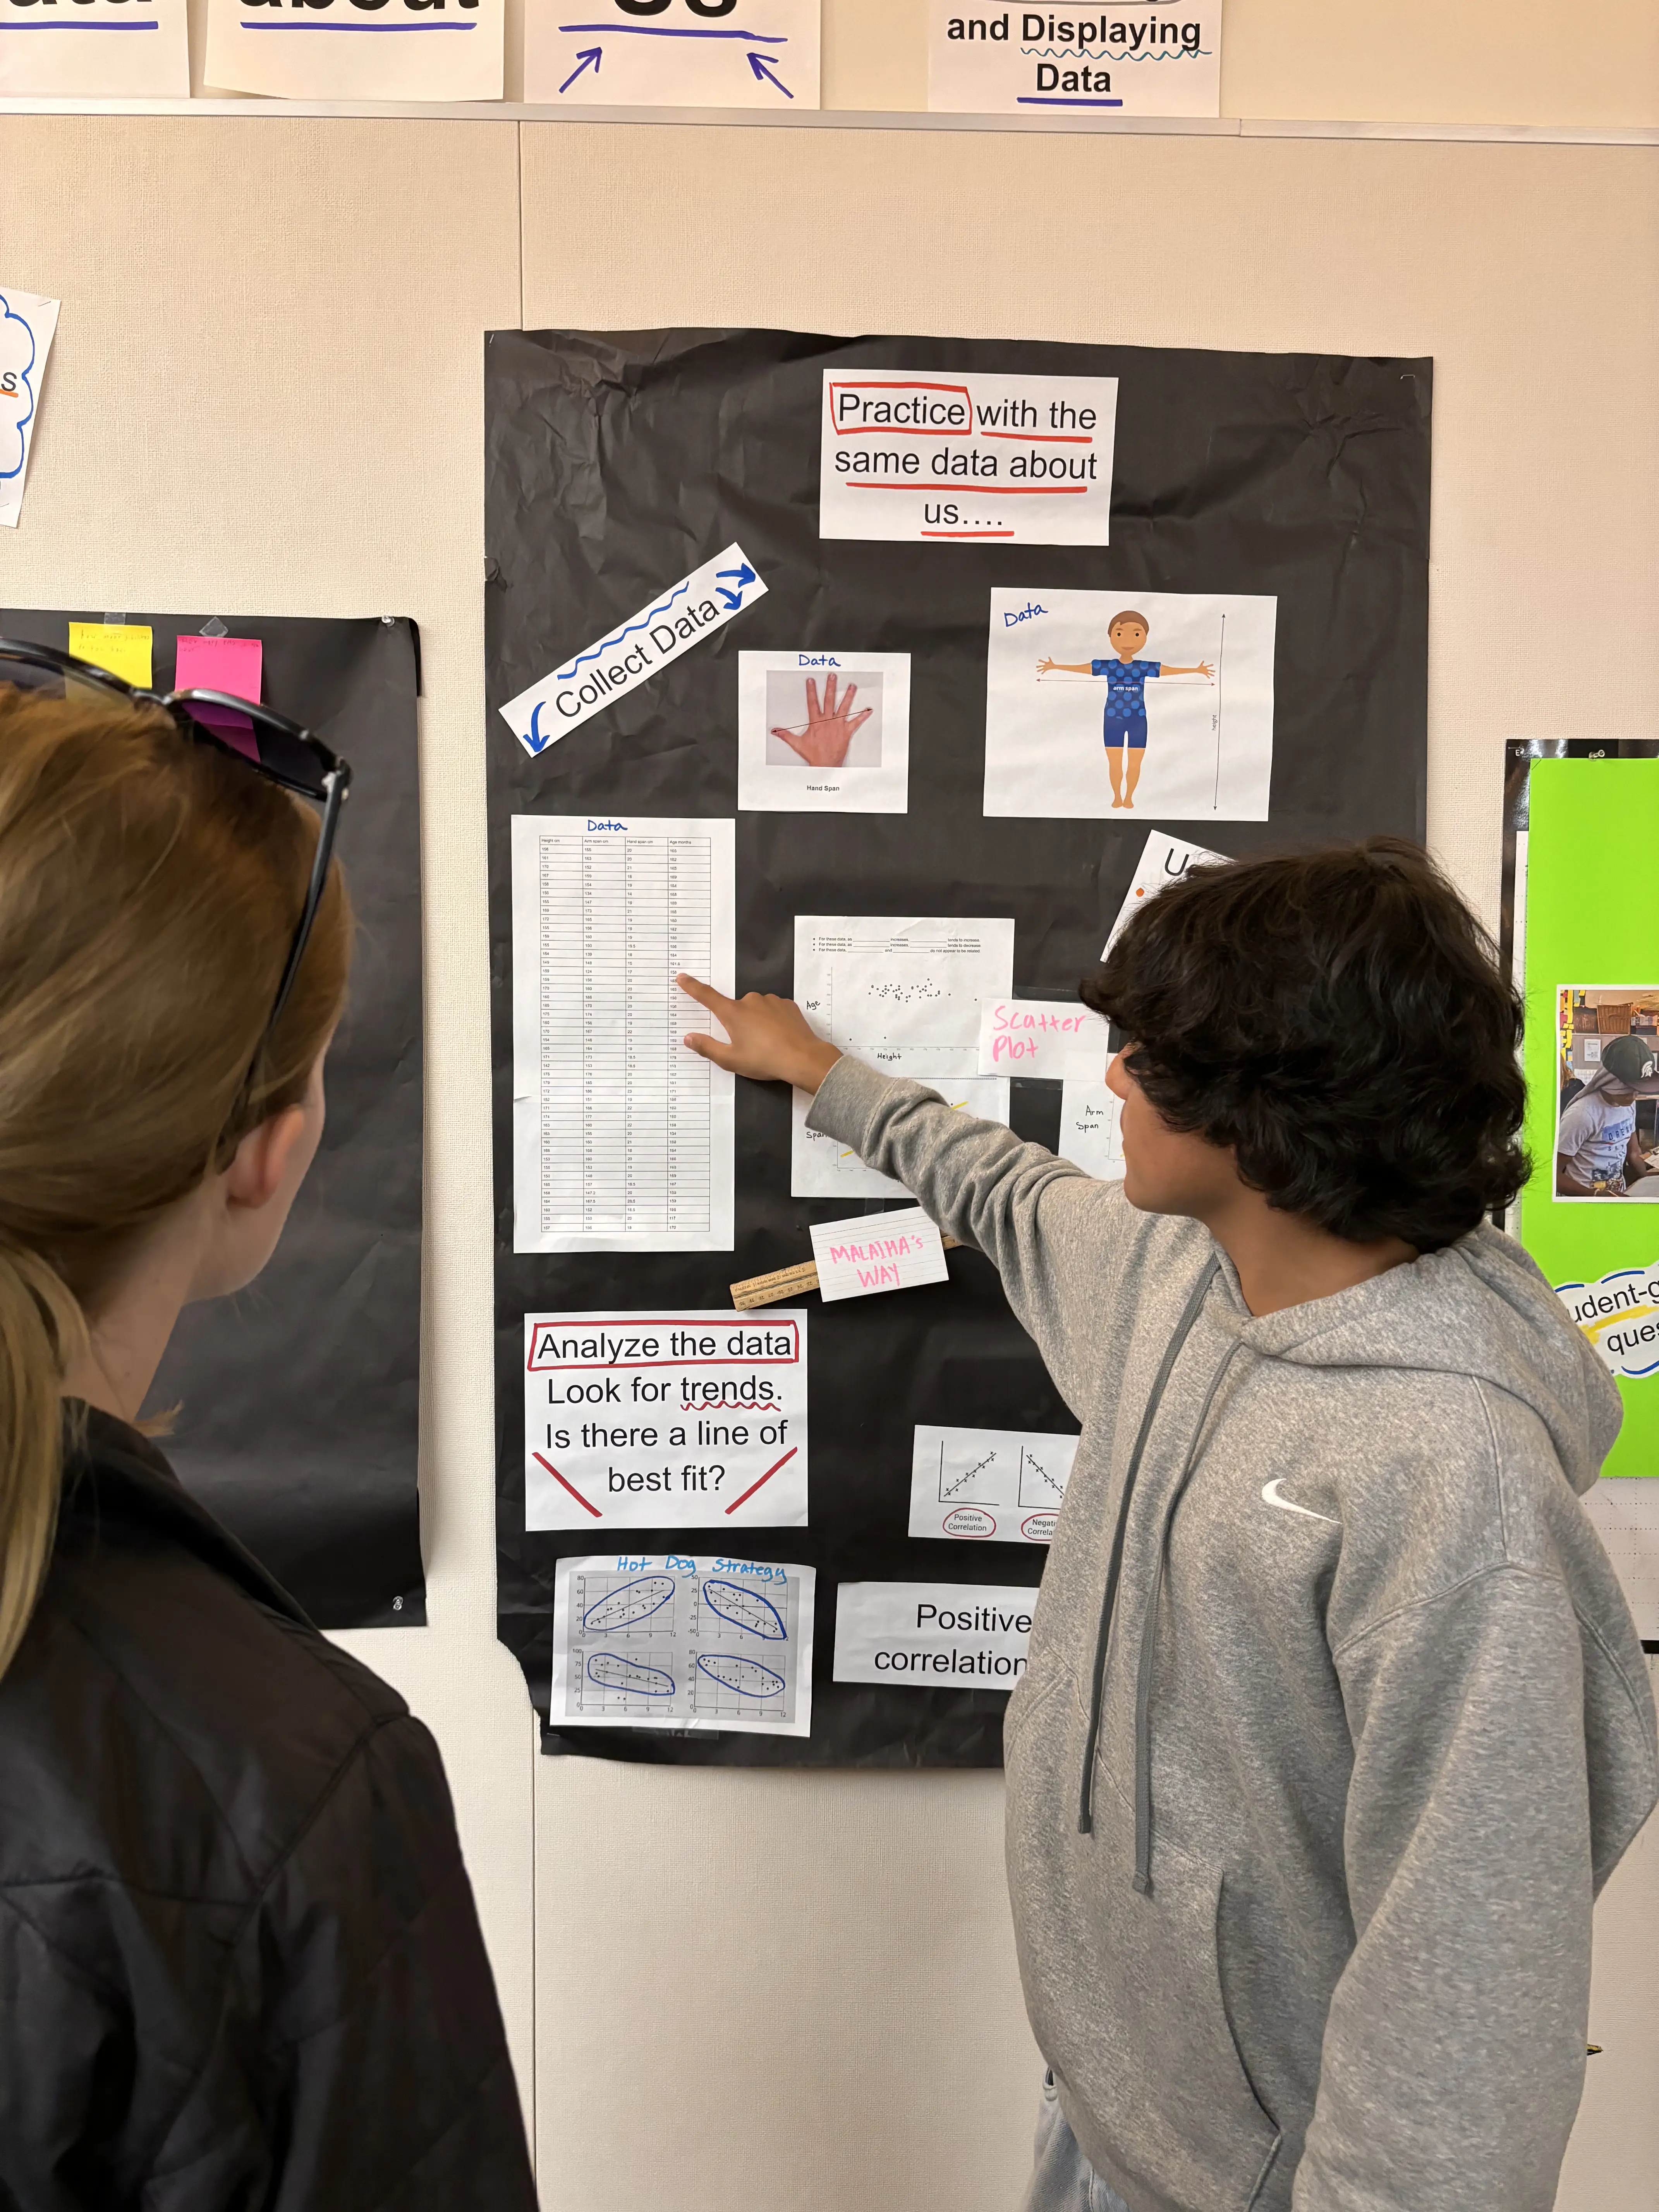
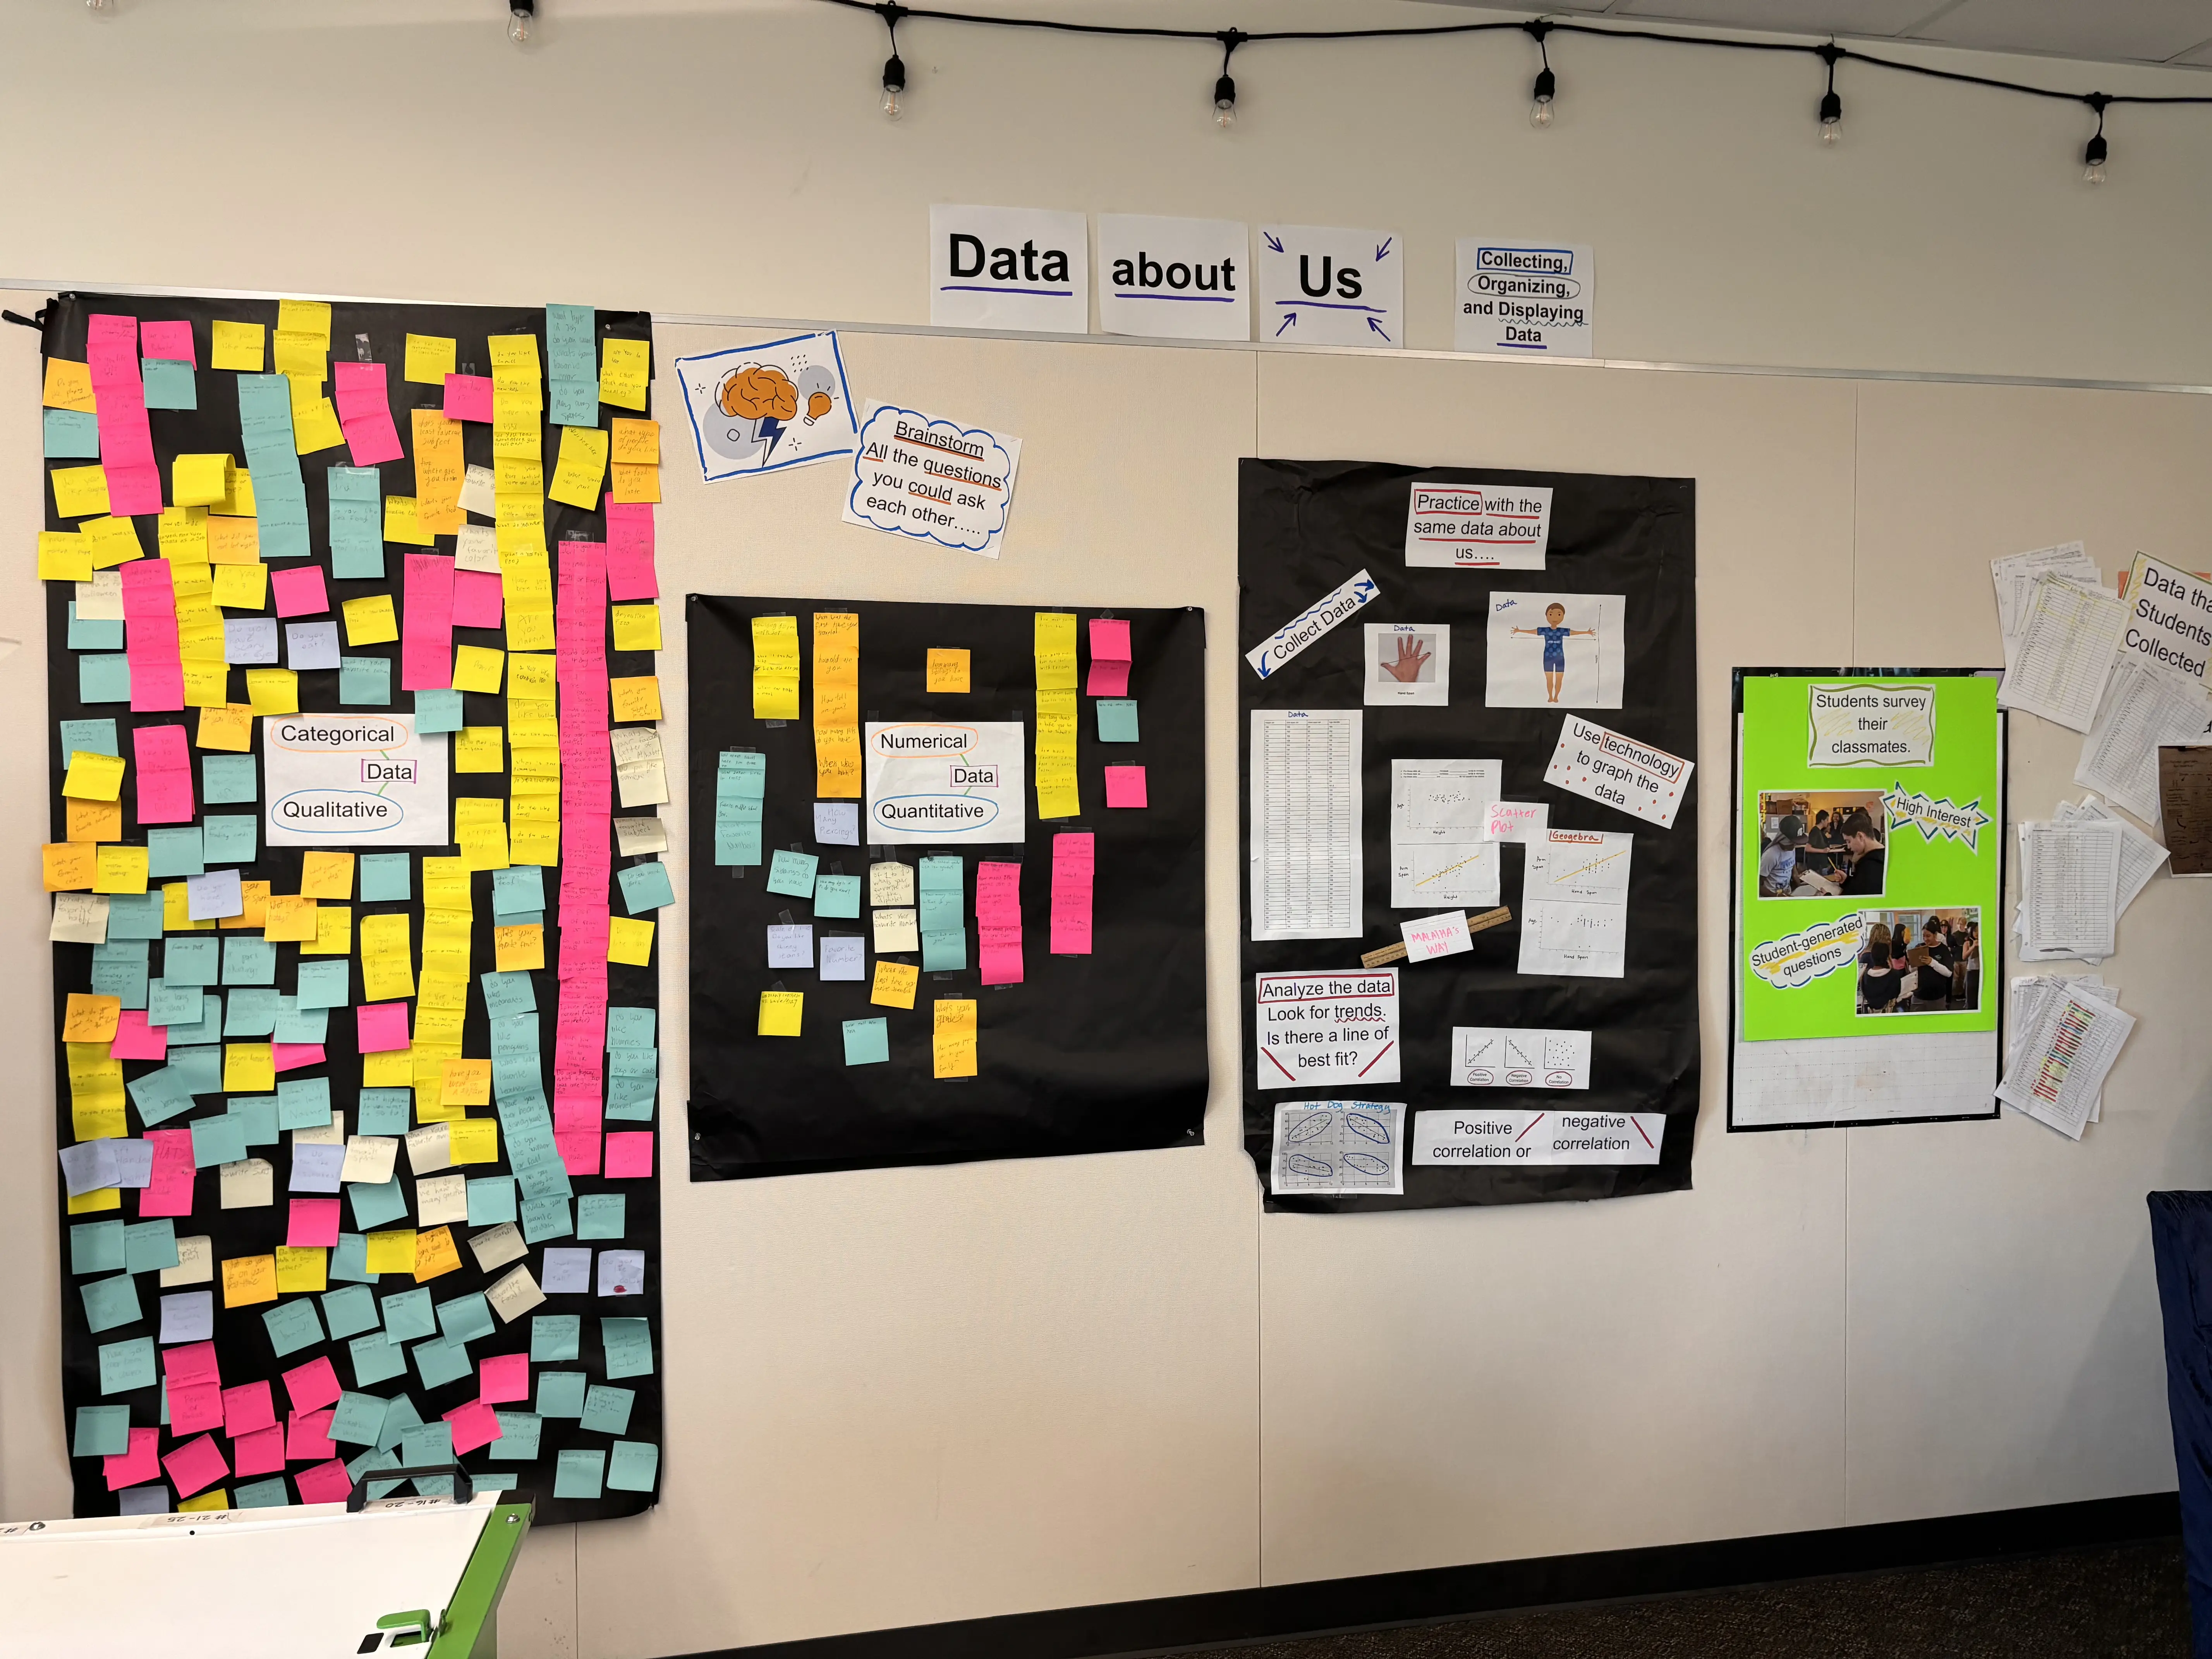
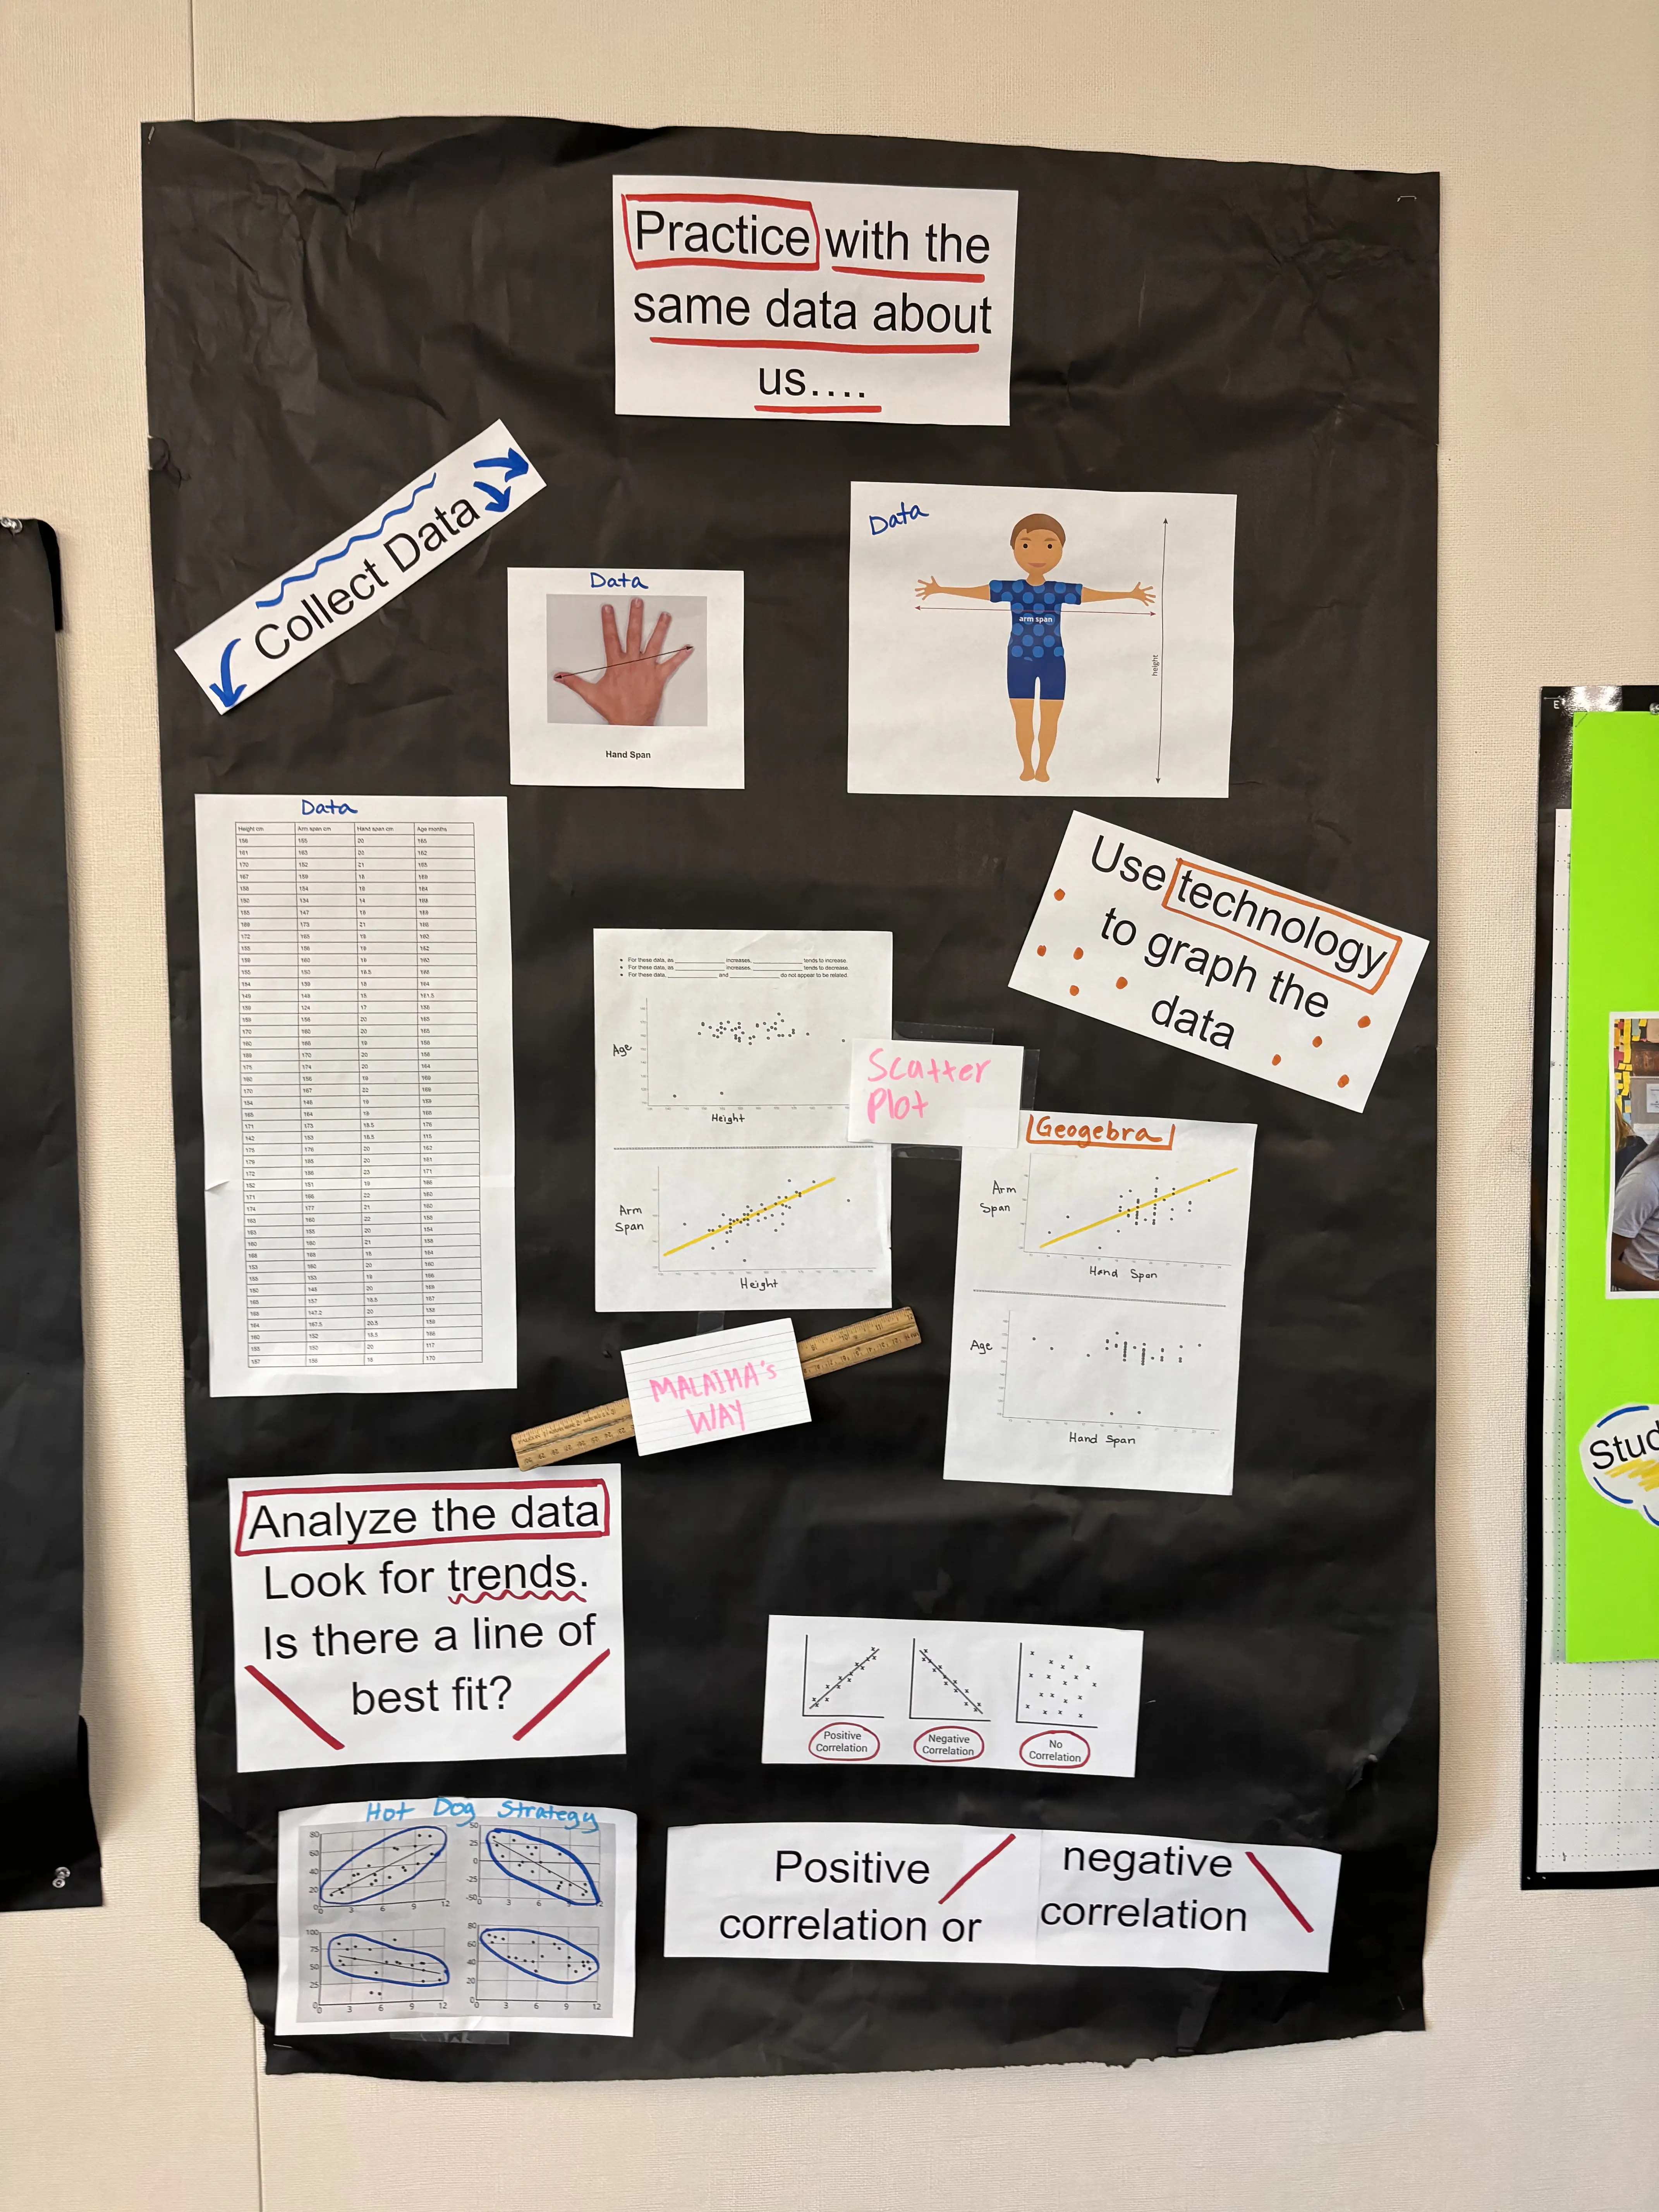
Data about Us - Collecting, organizing, and displaying data
Explain the data project:
Choose qualitative and quantitative questions, collect data, organize the data into tables, represent with bar graphs and scatter plots